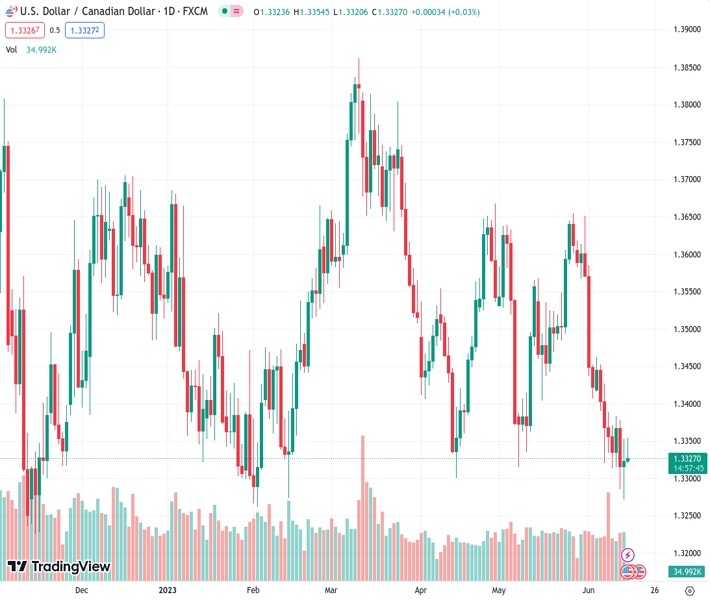
As the USD Index has experienced a slowdown in its upward movement, the USDCAD currency pair at 1.33289 encountered strong resistance near the 1.3350 level.
…
This is a premium post.
[s2If !current_user_can(access_s2member_level4)]Please register for FREE REGISTER to read full post below containing analysis. In case of any error or you think you are not able to read the full post below, please email us at support#nehcap.com [lwa][/s2If] [s2If current_user_can(access_s2member_level1)]
- USD/CAD has sensed stiff barricades around 1.3350 as the USD Index has witnessed exhaustion in the upside momentum.
The pair currently trades last at 1.33289.
The previous day high was 1.3353 while the previous day low was 1.3272. The daily 38.2% Fib levels comes at 1.3322, expected to provide support. Similarly, the daily 61.8% fib level is at 1.3303, expected to provide support.
The USD/CAD pair has sensed offers near the immediate resistance of 1.3350 in the early European session. The Loonie asset is losing strength despite more interest rate hikes by the Federal Reserve (Fed) will keep the policy divergence space of the US central bank with other global banks.
Nominal losses added in Asia by the S&P500 futures have been carry-forwarded in Europe as optimism inspired by a skip in the rate-hiking spree by the Fed has been offset by caution generated due to hawkish interest rate guidance.
Earlier, the US Dollar Index (DXY) pared its entire losses and climbed above 103.30 as Fed chair Jerome Powell confirmed that more interest rate hikes are in motion but is now struggling to maintain strength. Investors should note that United States headline inflation has critically softened, but core inflation is still showing persistence due to tight labor market conditions.
Fed Powell cited in his monetary policy statement that “Not seeing a lot of progress on core PCE inflation.” And “Want to see core PCE moving down decisively.”
The hawkish dot plot by the Fed has impacted the demand for US government bonds. This has led to a sharp jump in the 10-year US Treasury yields to near 3.83%.
The Canadian Dollar is going to show some action after the release of Canada’s monthly Manufacturing Sales data (April). A contraction of 0.2% is expected in the economic data vs. an expansion of 0.7%. It looks like higher interest rates by the Bank of Canada (BoC) have forced firms to underutilize their entire capacity, which has reduced the overall factory activity.
On the oil front, oil prices have shown a recovery move after a correction to near $68.00 as the USD Index has met offers. It is worth noting that Canada is the leading exporter of oil to the US and higher oil prices would strengthen the Canadian Dollar.
Technical Levels: Supports and Resistances
USDCAD currently trading at 1.3336 at the time of writing. Pair opened at 1.3324 and is trading with a change of 0.09 % .
| Overview | Overview.1 | |
|---|---|---|
| 0 | Today last price | 1.3336 |
| 1 | Today Daily Change | 0.0012 |
| 2 | Today Daily Change % | 0.0900 |
| 3 | Today daily open | 1.3324 |
The pair remains strongly bearish on the daily time frame. It trades below the 20 SMA @ 1.3472, 50 SMA 1.3481, 100 SMA @ 1.3514 and 200 SMA @ 1.3517.
| Trends | Trends.1 | |
|---|---|---|
| 0 | Daily SMA20 | 1.3472 |
| 1 | Daily SMA50 | 1.3481 |
| 2 | Daily SMA100 | 1.3514 |
| 3 | Daily SMA200 | 1.3517 |
The previous day high was 1.3353 while the previous day low was 1.3272. The daily 38.2% Fib levels comes at 1.3322, expected to provide support. Similarly, the daily 61.8% fib level is at 1.3303, expected to provide support.
Note the levels of interest below:
- Pivot support is noted at 1.328, 1.3236, 1.3199
- Pivot resistance is noted at 1.3361, 1.3397, 1.3442
| Levels | Levels.1 |
|---|---|
| Previous Daily High | 1.3353 |
| Previous Daily Low | 1.3272 |
| Previous Weekly High | 1.3462 |
| Previous Weekly Low | 1.3313 |
| Previous Monthly High | 1.3655 |
| Previous Monthly Low | 1.3315 |
| Daily Fibonacci 38.2% | 1.3322 |
| Daily Fibonacci 61.8% | 1.3303 |
| Daily Pivot Point S1 | 1.3280 |
| Daily Pivot Point S2 | 1.3236 |
| Daily Pivot Point S3 | 1.3199 |
| Daily Pivot Point R1 | 1.3361 |
| Daily Pivot Point R2 | 1.3397 |
| Daily Pivot Point R3 | 1.3442 |
[/s2If]
Nehcap Expert Advisor
The NEHCAP MT4 EA is high quality professional trading system geared to generate returns without using GRID or martingales. Each trade has strict risk per trade parameter. The pairs under management include EURUSD, GBPUSD, AUDCAD, AUDNZD,GBPAUD, EURAUD, EURCAD, CHFJPY and many more.
The system is trading live: LIVE ACCOUNT TRACKING
You can run it free. Apply for a free trial and track our account. Buy the system or use profit share mechanism to generate returns on your MT4.
Join Our Telegram Group
")


