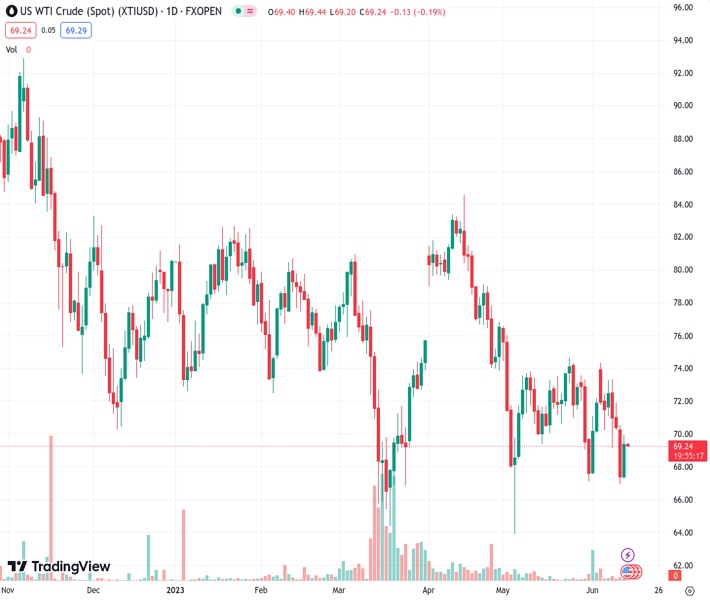
WTI crude oil is experiencing a consolidation of its largest daily increase in two weeks, while also losing momentum from its rebound after hitting a low point not seen in 1.5 months.
…
This is a premium post.
[s2If !current_user_can(access_s2member_level4)]Please register for FREE REGISTER to read full post below containing analysis. In case of any error or you think you are not able to read the full post below, please email us at support#nehcap.com [lwa][/s2If] [s2If current_user_can(access_s2member_level1)]
- WTI crude oil consolidates the biggest daily gain in two weeks, fades bounce off 1.5-month low.
The pair currently trades last at 69.32.
The previous day high was 69.96 while the previous day low was 67.31. The daily 38.2% Fib levels comes at 68.95, expected to provide support. Similarly, the daily 61.8% fib level is at 68.33, expected to provide support.
WTI crude oil clings to mild losses around $69.30 as it struggles to extend the previous day’s heavy rebound from the lowest levels in six weeks amid Wednesday’s sluggish Asian session. In doing so, the black gold aptly portrays the pre-Fed anxiety while also taking clues from the weekly prints of the American Petroleum Institute’s (API) Oil inventory data.
That said, the API Crude Oil Stock data for the period ended on June 9 flashed an addition of 1.024M barrels versus the previous contraction of 1.71 M.
It’s worth noting that the heavy reduction in the US Strategic Petroleum Reserves (SPR) joined the downbeat US Dollar to underpin the crude oil’s recovery on Tuesday. As per the latest data, the US SPR is down 33% compared to one year ago levels as it prints 353M level in the recent update.
Elsewhere, the US Dollar Index (DXY) slumped the most in a week, to the lowest levels since May 22, after the US inflation data fuelled speculations of the US central bank’s halt to the rate hike trajectory present in the last 10 monetary policy meetings. That said, the US Consumer Price Index (CPI) drops more-than-expected and prior releases to 0.1% MoM and 4.0% YoY. However, the Core CPI, known as the CPI ex Food & Energy, matches 0.4% monthly and 5.3% yearly forecasts. It’s worth noting that the US headline CPI dropped to the lowest since March 2021 and hence justifies the market’s expectations of the US Federal Reserve (Fed) hawkish halt, which in turn should have weighed on the US Dollar.
It’s worth mentioning that the fears of the US-Iran deal contrasted with the price-positive statements from Saudi Arabia, as well as with the OPEC+ production cuts, to challenge the Oil prices earlier.
Looking ahead, the pre-Fed caution may restrict immediate WTI moves but the US Producer Price Index (PPI) for May and the weekly official oil inventory data, released by the Energy Information Administration (EIA), expected -1.291M versus -0.45M prior can entertain the Oil traders.
A clear upside break of a one-week-old descending resistance line, now immediate support around $67.80, directs WTI crude oil buyers to the $70.00 round figure before highlighting the 10-DMA hurdle of around $70.60.
Technical Levels: Supports and Resistances
XTIUSD currently trading at 69.32 at the time of writing. Pair opened at 69.44 and is trading with a change of -0.17% % .
| Overview | Overview.1 | |
|---|---|---|
| 0 | Today last price | 69.32 |
| 1 | Today Daily Change | -0.12 |
| 2 | Today Daily Change % | -0.17% |
| 3 | Today daily open | 69.44 |
The pair remains strongly bearish on the daily time frame. It trades below the 20 SMA @ 71.41, 50 SMA 74.28, 100 SMA @ 75.01 and 200 SMA @ 78.39.
| Trends | Trends.1 | |
|---|---|---|
| 0 | Daily SMA20 | 71.41 |
| 1 | Daily SMA50 | 74.28 |
| 2 | Daily SMA100 | 75.01 |
| 3 | Daily SMA200 | 78.39 |
The previous day high was 69.96 while the previous day low was 67.31. The daily 38.2% Fib levels comes at 68.95, expected to provide support. Similarly, the daily 61.8% fib level is at 68.33, expected to provide support.
Note the levels of interest below:
- Pivot support is noted at 67.85, 66.25, 65.2
- Pivot resistance is noted at 70.5, 71.56, 73.15
| Levels | Levels.1 |
|---|---|
| Previous Daily High | 69.96 |
| Previous Daily Low | 67.31 |
| Previous Weekly High | 74.36 |
| Previous Weekly Low | 69.17 |
| Previous Monthly High | 76.61 |
| Previous Monthly Low | 64.31 |
| Daily Fibonacci 38.2% | 68.95 |
| Daily Fibonacci 61.8% | 68.33 |
| Daily Pivot Point S1 | 67.85 |
| Daily Pivot Point S2 | 66.25 |
| Daily Pivot Point S3 | 65.20 |
| Daily Pivot Point R1 | 70.50 |
| Daily Pivot Point R2 | 71.56 |
| Daily Pivot Point R3 | 73.15 |
[/s2If]
Nehcap Expert Advisor
The NEHCAP MT4 EA is high quality professional trading system geared to generate returns without using GRID or martingales. Each trade has strict risk per trade parameter. The pairs under management include EURUSD, GBPUSD, AUDCAD, AUDNZD,GBPAUD, EURAUD, EURCAD, CHFJPY and many more.
The system is trading live: LIVE ACCOUNT TRACKING
You can run it free. Apply for a free trial and track our account. Buy the system or use profit share mechanism to generate returns on your MT4.
Join Our Telegram Group
")


