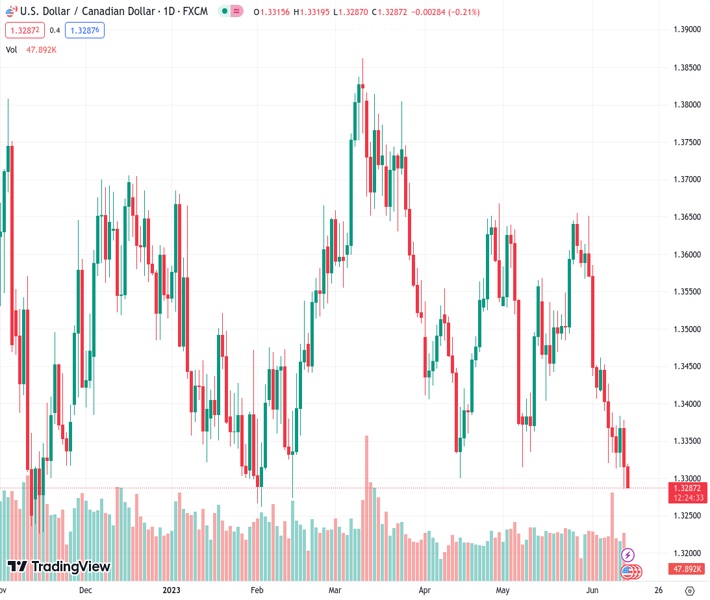
#USDCAD @ 1.32893 has shown a vertical fall to near 1.3300 due to a solid recovery in the oil price.
…
This is a premium post.
[s2If !current_user_can(access_s2member_level4)]Please register for FREE REGISTER to read full post below containing analysis. In case of any error or you think you are not able to read the full post below, please email us at support#nehcap.com [lwa][/s2If] [s2If current_user_can(access_s2member_level1)]
- USD/CAD has shown a vertical fall to near 1.3300 due to a solid recovery in the oil price.
The pair currently trades last at 1.32893.
The previous day high was 1.3379 while the previous day low was 1.3286. The daily 38.2% Fib levels comes at 1.3321, expected to provide resistance. Similarly, the daily 61.8% fib level is at 1.3343, expected to provide resistance.
The USD/CAD pair has shown a perpendicular fall to the round-level support of 1.3300 after facing stiff barricades around 1.3320 in the European session. The Loonie asset has dropped sharply following the footprints of the US Dollar Index (DXY). It is observed that the pace of falling Loonie is higher than the velocity of decline in the USD Index.
Upbeat oil prices are providing a cushion to the Canadian Dollar as investors are hoping for a neutral interest rate policy by the Federal Reserve (Fed). Market sentiment has turned extremely positive as a skip in the policy-tightening spell by the Fed will trim fears of a recession in the United States.
Meanwhile, the street is hoping that the Bank of Canada (BoC) will continue raising interest rates further due to resilience in the Canadian economy. BoC Governor Tiff Macklem raised interest rates surprisingly by 25 basis points (bps) to 4.75% last week.
USD/CAD has tested the demand zone placed in a range of 1.3270-1.3300 on a daily scale. The Loonie is expected to remain volatile after the interest rate decision by the Fed. Downward-sloping 10-period Exponential Moving Average (EMA) at 1.3380 indicates that the short-term trend is extremely bearish.
The Relative Strength Index (RSI) (14) has shifted into the bearish range of 20.00-40.00, which indicates that the downside momentum is already active.
Should the asset break below June 13 low at 1.3286, Canadian Dollar bulls will expose the Loonie asset to 15 November 2022 low at 1.3226 followed by the round-level support at 1.3200.
On the flip side, a break above June 08 high at 1.3388 will drive the asset toward June 05 high at 1.3462 and the psychological resistance at 1.3500.
Technical Levels: Supports and Resistances
USDCAD currently trading at 1.3293 at the time of writing. Pair opened at 1.3318 and is trading with a change of -0.19 % .
| Overview | Overview.1 | |
|---|---|---|
| 0 | Today last price | 1.3293 |
| 1 | Today Daily Change | -0.0025 |
| 2 | Today Daily Change % | -0.1900 |
| 3 | Today daily open | 1.3318 |
The pair remains strongly bearish on the daily time frame. It trades below the 20 SMA @ 1.3478, 50 SMA 1.3484, 100 SMA @ 1.3515 and 200 SMA @ 1.3516.
| Trends | Trends.1 | |
|---|---|---|
| 0 | Daily SMA20 | 1.3478 |
| 1 | Daily SMA50 | 1.3484 |
| 2 | Daily SMA100 | 1.3515 |
| 3 | Daily SMA200 | 1.3516 |
The previous day high was 1.3379 while the previous day low was 1.3286. The daily 38.2% Fib levels comes at 1.3321, expected to provide resistance. Similarly, the daily 61.8% fib level is at 1.3343, expected to provide resistance.
Note the levels of interest below:
- Pivot support is noted at 1.3277, 1.3235, 1.3184
- Pivot resistance is noted at 1.3369, 1.342, 1.3462
| Levels | Levels.1 |
|---|---|
| Previous Daily High | 1.3379 |
| Previous Daily Low | 1.3286 |
| Previous Weekly High | 1.3462 |
| Previous Weekly Low | 1.3313 |
| Previous Monthly High | 1.3655 |
| Previous Monthly Low | 1.3315 |
| Daily Fibonacci 38.2% | 1.3321 |
| Daily Fibonacci 61.8% | 1.3343 |
| Daily Pivot Point S1 | 1.3277 |
| Daily Pivot Point S2 | 1.3235 |
| Daily Pivot Point S3 | 1.3184 |
| Daily Pivot Point R1 | 1.3369 |
| Daily Pivot Point R2 | 1.3420 |
| Daily Pivot Point R3 | 1.3462 |
[/s2If]
Nehcap Expert Advisor
The NEHCAP MT4 EA is high quality professional trading system geared to generate returns without using GRID or martingales. Each trade has strict risk per trade parameter. The pairs under management include EURUSD, GBPUSD, AUDCAD, AUDNZD,GBPAUD, EURAUD, EURCAD, CHFJPY and many more.
The system is trading live: LIVE ACCOUNT TRACKING
You can run it free. Apply for a free trial and track our account. Buy the system or use profit share mechanism to generate returns on your MT4.
Join Our Telegram Group
")


