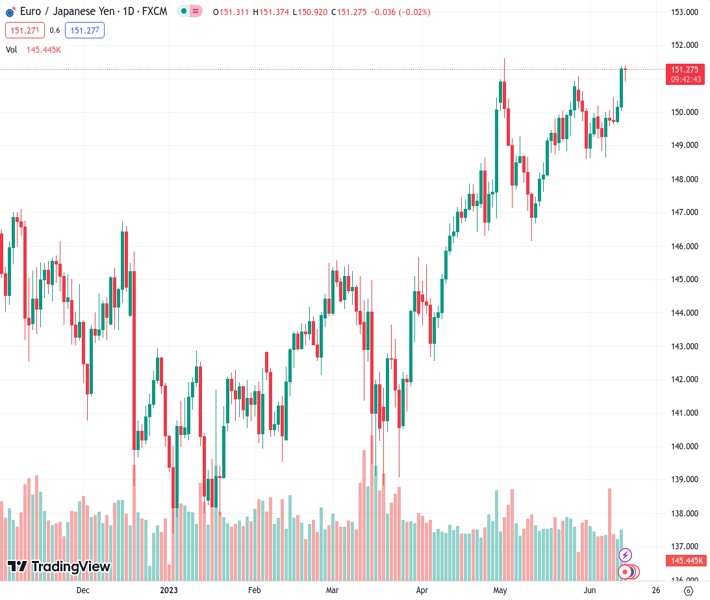
The value of EURJPY has increased during the week and has now exceeded 151.00. It is currently 151.284.
…
This is a premium post.
[s2If !current_user_can(access_s2member_level4)]Please register for FREE REGISTER to read full post below containing analysis. In case of any error or you think you are not able to read the full post below, please email us at support#nehcap.com [lwa][/s2If] [s2If current_user_can(access_s2member_level1)]
- EUR/JPY adds to the weekly upside and surpasses 151.00.
The pair currently trades last at 151.284.
The previous day high was 151.38 while the previous day low was 150.04. The daily 38.2% Fib levels comes at 150.86, expected to provide support. Similarly, the daily 61.8% fib level is at 150.55, expected to provide support.
EUR/JPY looks to add to the ongoing rebound above the key 151.00 hurdle in pre-Fed trading on Wednesday.
In case bulls keep pushing higher, the next relevant resistance level now emerges at the 2023 peak at 151.61 (May 2). The surpass of the latter should meet the next target of importance not before the weekly high at 156.83 (September 22, 2008).
So far, further upside looks favoured while the cross trades above the 200-day SMA, today at 144.35.
Technical Levels: Supports and Resistances
EURJPY currently trading at 151.3 at the time of writing. Pair opened at 151.34 and is trading with a change of -0.03 % .
| Overview | Overview.1 | |
|---|---|---|
| 0 | Today last price | 151.30 |
| 1 | Today Daily Change | 45.00 |
| 2 | Today Daily Change % | -0.03 |
| 3 | Today daily open | 151.34 |
The pair remains strongly bullish on the daily timeframe. It trades above its 20 SMA @ 149.8, 50 SMA 148.32, 100 SMA @ 145.53 and 200 SMA @ 144.35.
| Trends | Trends.1 | |
|---|---|---|
| 0 | Daily SMA20 | 149.80 |
| 1 | Daily SMA50 | 148.32 |
| 2 | Daily SMA100 | 145.53 |
| 3 | Daily SMA200 | 144.35 |
The previous day high was 151.38 while the previous day low was 150.04. The daily 38.2% Fib levels comes at 150.86, expected to provide support. Similarly, the daily 61.8% fib level is at 150.55, expected to provide support.
Note the levels of interest below:
- Pivot support is noted at 150.46, 149.57, 149.11
- Pivot resistance is noted at 151.8, 152.26, 153.14
| Levels | Levels.1 |
|---|---|
| Previous Daily High | 151.38 |
| Previous Daily Low | 150.04 |
| Previous Weekly High | 150.44 |
| Previous Weekly Low | 148.63 |
| Previous Monthly High | 151.62 |
| Previous Monthly Low | 146.14 |
| Daily Fibonacci 38.2% | 150.86 |
| Daily Fibonacci 61.8% | 150.55 |
| Daily Pivot Point S1 | 150.46 |
| Daily Pivot Point S2 | 149.57 |
| Daily Pivot Point S3 | 149.11 |
| Daily Pivot Point R1 | 151.80 |
| Daily Pivot Point R2 | 152.26 |
| Daily Pivot Point R3 | 153.14 |
[/s2If]
Nehcap Expert Advisor
The NEHCAP MT4 EA is high quality professional trading system geared to generate returns without using GRID or martingales. Each trade has strict risk per trade parameter. The pairs under management include EURUSD, GBPUSD, AUDCAD, AUDNZD,GBPAUD, EURAUD, EURCAD, CHFJPY and many more.
The system is trading live: LIVE ACCOUNT TRACKING
You can run it free. Apply for a free trial and track our account. Buy the system or use profit share mechanism to generate returns on your MT4.
Join Our Telegram Group
")


