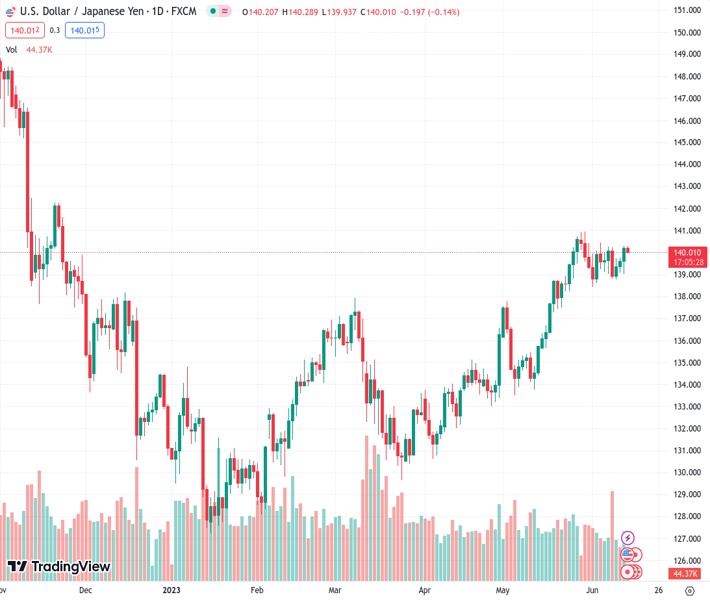
The USDJPY currency pair, trading at 139.972, is facing difficulties near its intraday low and has registered its initial daily decline in the last four days. The prediction from @nehcap is that there will be more downsides to come.
…
This is a premium post.
[s2If !current_user_can(access_s2member_level4)]Please register for FREE REGISTER to read full post below containing analysis. In case of any error or you think you are not able to read the full post below, please email us at support#nehcap.com [lwa][/s2If] [s2If current_user_can(access_s2member_level1)]
- USD/JPY struggles around intraday low, prints the first daily loss in four.
The pair currently trades last at 139.972.
The previous day high was 140.31 while the previous day low was 139.01. The daily 38.2% Fib levels comes at 139.81, expected to provide support. Similarly, the daily 61.8% fib level is at 139.51, expected to provide support.
USD/JPY bears struggle to keep the reins amid early Wednesday in Europe, despite snapping a three-day uptrend by retreating from a one-week high to around 140.00 at the latest. In doing so, the Yen pair portrays the market’s cautious mood ahead of the all-important Federal Open Market Committee (FOMC) monetary policy meeting by poking the resistance-turned-support line stretched from early May.
Also read: USD/JPY trades with mild negative bias around 140.00, downside seems limited ahead of Fed
Apart from the previous resistance line, the bullish MACD signals and upbeat RSI (14) line also keeps the USD/JPY buyers hopeful.
Hence, the Yen pair stays on the bull’s radar unless breaking the aforementioned trend line, currently around 139.90.
Even if the quote breaks the 139.90 mark, the 100-bar Exponential Moving Average (EMA) and the monthly bottom, respectively near 139.10 and 138.40, can challenge the USD/JPY sellers.
In a case where the quote drops past 138.40, the 200-EMA support of 138.00 will act as the last defense of the USD/JPY buyers.
On the contrary, recovery moves may initially aim for the previous monthly high of around 140.90, as well as the 141.00 round figure.
Following that, the 61.8% Fibonacci Expansion (FE) of its May 16 to June 01 moves, near 141.70, could gain the USD/JPY bull’s attention.
If at all the pair remains firmer past 141.70, the 142.00 threshold and the late November 2022 peak of around 142.25 can challenge the buyers.
Trend: Further downside expected
Technical Levels: Supports and Resistances
USDJPY currently trading at 140.04 at the time of writing. Pair opened at 140.22 and is trading with a change of -0.13% % .
| Overview | Overview.1 | |
|---|---|---|
| 0 | Today last price | 140.04 |
| 1 | Today Daily Change | -0.18 |
| 2 | Today Daily Change % | -0.13% |
| 3 | Today daily open | 140.22 |
The pair remains strongly bullish on the daily timeframe. It trades above its 20 SMA @ 139.38, 50 SMA 136.37, 100 SMA @ 134.69 and 200 SMA @ 137.28.
| Trends | Trends.1 | |
|---|---|---|
| 0 | Daily SMA20 | 139.38 |
| 1 | Daily SMA50 | 136.37 |
| 2 | Daily SMA100 | 134.69 |
| 3 | Daily SMA200 | 137.28 |
The previous day high was 140.31 while the previous day low was 139.01. The daily 38.2% Fib levels comes at 139.81, expected to provide support. Similarly, the daily 61.8% fib level is at 139.51, expected to provide support.
Note the levels of interest below:
- Pivot support is noted at 139.39, 138.55, 138.09
- Pivot resistance is noted at 140.68, 141.14, 141.98
| Levels | Levels.1 |
|---|---|
| Previous Daily High | 140.31 |
| Previous Daily Low | 139.01 |
| Previous Weekly High | 140.45 |
| Previous Weekly Low | 138.76 |
| Previous Monthly High | 140.93 |
| Previous Monthly Low | 133.50 |
| Daily Fibonacci 38.2% | 139.81 |
| Daily Fibonacci 61.8% | 139.51 |
| Daily Pivot Point S1 | 139.39 |
| Daily Pivot Point S2 | 138.55 |
| Daily Pivot Point S3 | 138.09 |
| Daily Pivot Point R1 | 140.68 |
| Daily Pivot Point R2 | 141.14 |
| Daily Pivot Point R3 | 141.98 |
[/s2If]
Nehcap Expert Advisor
The NEHCAP MT4 EA is high quality professional trading system geared to generate returns without using GRID or martingales. Each trade has strict risk per trade parameter. The pairs under management include EURUSD, GBPUSD, AUDCAD, AUDNZD,GBPAUD, EURAUD, EURCAD, CHFJPY and many more.
The system is trading live: LIVE ACCOUNT TRACKING
You can run it free. Apply for a free trial and track our account. Buy the system or use profit share mechanism to generate returns on your MT4.
Join Our Telegram Group
")


