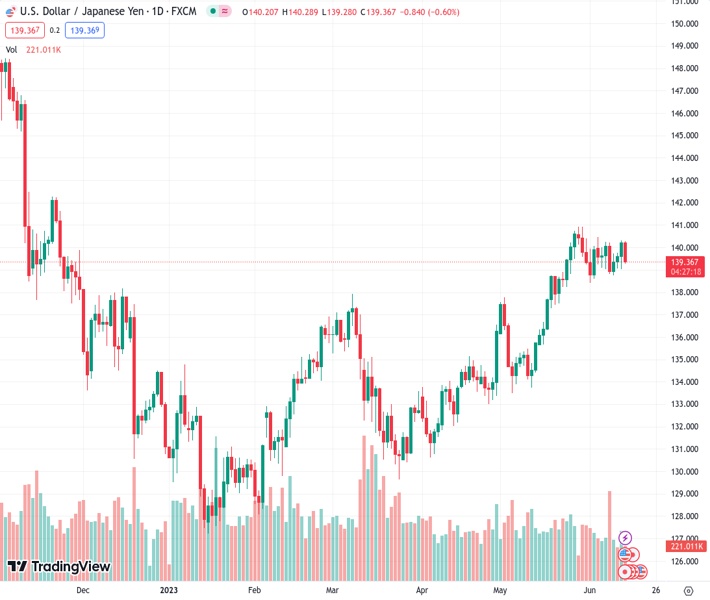
The USDJPY currency pair at 139.383 has dropped below its 20-day Simple Moving Average (SMA) of 139.44 and is currently trading around 139.35.
…
This is a premium post.
[s2If !current_user_can(access_s2member_level4)]Please register for FREE REGISTER to read full post below containing analysis. In case of any error or you think you are not able to read the full post below, please email us at support#nehcap.com [lwa][/s2If] [s2If current_user_can(access_s2member_level1)]
- USD/JPY lost the 20-day SMA at 139.44 and trades at the 139.35 area.
The pair currently trades last at 139.383.
The previous day high was 140.31 while the previous day low was 139.01. The daily 38.2% Fib levels comes at 139.81, expected to provide resistance. Similarly, the daily 61.8% fib level is at 139.51, expected to provide resistance.
The USD/JPY lost over 60 pips during the New York session as the Greenback faced severe selling pressure after Producer Price Index (PPI) data from the US showed lower-than-expected ‘factory gate’ inflation. US bond yields are in decline, favoring the JPY, Ahead of the Federal Reserve’s (Fed) decision at 18:00 GMT.
The US Bureau of Labor Statistics released on Tuesday the PPI report that showed a decrease of 0.3% MoM in May, more than the 0.1% slide expected; the YoY measure fell to 1.1%. On the other hand, the Core figure rose 0.2% MoM in the same period matching expectations, while the yearly came in at 2.8%.
As a result, the US bond yields have weakened across the curve and applied pressure to the USD. The 10-year bond yield fell to 3.79%, while the 2-year yield sits at 4.62% and the 5-year yield at 3.96%, marking a 1.58% slide, respectively. Elsewhere, the S&P 500 index (SPX) rose to its highest level since April 2022 and applied further pressure to the US Dollar as riskier assets drove away demand from the safe-haven Greenback and the JPY.
Regarding the Fed’s decision, markets continue to discount a no hike, and investors will look for clues regarding forward guidance in the updated macro forecast, the revised dot plots and in Chair Powell’s press conference. As for now, analysts expect that the Fed will resume tightening in the next July meeting, where market participants are expecting a 25 basis point (bps) hike.
In terms of technical analysis, USD/JPY maintains a neutral stance for the short term as indicators turn red on the daily chart. That being said, the trajectory for the following sessions will be determined by the Fed’s decision and the expectations for future meetings.
After losing the 20-day Simple Moving Average (SMA) at the 139.45 level, support levels for the pair line up at the psychological mark at 139.00 and the 200-day (SMA) at 137.25. Furthermore, a move above the 140.00 zone would suggest a continuation of the bullish trend for USD/JPY, with next resistances at the 140.50 area and a multi-month high at 140.90.
Technical Levels: Supports and Resistances
USDJPY currently trading at 139.35 at the time of writing. Pair opened at 140.22 and is trading with a change of -0.62 % .
| Overview | Overview.1 | |
|---|---|---|
| 0 | Today last price | 139.35 |
| 1 | Today Daily Change | -0.87 |
| 2 | Today Daily Change % | -0.62 |
| 3 | Today daily open | 140.22 |
The pair is trading below its 20 Daily moving average @ 139.38, above its 50 Daily moving average @ 136.37 , above its 100 Daily moving average @ 134.69 and above its 200 Daily moving average @ 137.28
| Trends | Trends.1 | |
|---|---|---|
| 0 | Daily SMA20 | 139.38 |
| 1 | Daily SMA50 | 136.37 |
| 2 | Daily SMA100 | 134.69 |
| 3 | Daily SMA200 | 137.28 |
The previous day high was 140.31 while the previous day low was 139.01. The daily 38.2% Fib levels comes at 139.81, expected to provide resistance. Similarly, the daily 61.8% fib level is at 139.51, expected to provide resistance.
Note the levels of interest below:
- Pivot support is noted at 139.39, 138.55, 138.09
- Pivot resistance is noted at 140.68, 141.14, 141.98
| Levels | Levels.1 |
|---|---|
| Previous Daily High | 140.31 |
| Previous Daily Low | 139.01 |
| Previous Weekly High | 140.45 |
| Previous Weekly Low | 138.76 |
| Previous Monthly High | 140.93 |
| Previous Monthly Low | 133.50 |
| Daily Fibonacci 38.2% | 139.81 |
| Daily Fibonacci 61.8% | 139.51 |
| Daily Pivot Point S1 | 139.39 |
| Daily Pivot Point S2 | 138.55 |
| Daily Pivot Point S3 | 138.09 |
| Daily Pivot Point R1 | 140.68 |
| Daily Pivot Point R2 | 141.14 |
| Daily Pivot Point R3 | 141.98 |
[/s2If]
Nehcap Expert Advisor
The NEHCAP MT4 EA is high quality professional trading system geared to generate returns without using GRID or martingales. Each trade has strict risk per trade parameter. The pairs under management include EURUSD, GBPUSD, AUDCAD, AUDNZD,GBPAUD, EURAUD, EURCAD, CHFJPY and many more.
The system is trading live: LIVE ACCOUNT TRACKING
You can run it free. Apply for a free trial and track our account. Buy the system or use profit share mechanism to generate returns on your MT4.
Join Our Telegram Group
")


