The USDCNH exchange rate of 7.17274 has been fluctuating at its highest levels since late November 2022, but has recently experienced a slight drop. Nehcap’s perspective is that a retracement can be anticipated.
…
This is a premium post.
[s2If !current_user_can(access_s2member_level4)]Please register for FREE REGISTER to read full post below containing analysis. In case of any error or you think you are not able to read the full post below, please email us at support#nehcap.com [lwa][/s2If] [s2If current_user_can(access_s2member_level1)]
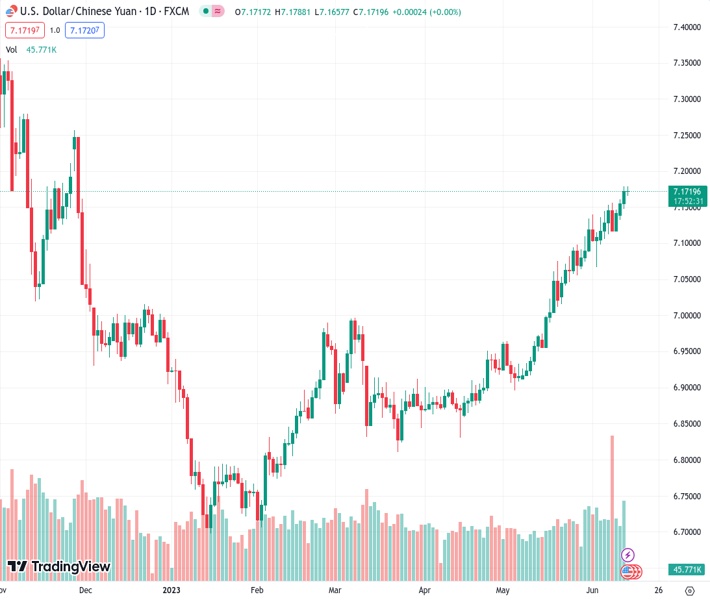
- USD/CNH seesaws at the highest levels since late November 2022, mildly offered of late.
The pair currently trades last at 7.17274.
The previous day high was 7.1788 while the previous day low was 7.1484. The daily 38.2% Fib levels comes at 7.1672, expected to provide support. Similarly, the daily 61.8% fib level is at 7.1601, expected to provide support.
USD/CNH struggles to extend a three-day uptrend as it retreats from the highest levels in nearly eight months on the key Federal Open Market Committee (FOMC) monetary policy meeting day. That said, the offshore Chinese Yuan (CNH) pair prints mild losses near 7.1720 by the press time, after rising to the highest levels since April 2022 with the latest peak of 7.1788.
It’s worth noting that the overbought RSI conditions join the pre-Fed anxiety to challenge the USD/CNH traders within a one-week-old rising trend channel, currently between 7.2020 and 7.1350 at the latest. Adding strength to the 7.1350 support level is the 50-SMA.
In a case where the USD/CNH drops below 7.1350, the previous resistance line stretched from late April, close to 7.0680, will precede a two-month-old rising support line, surrounding 7.0570 as we write, to please the offshore Chinese Yuan buyers.
However, the 200-SMA level of 7.0380 acts as the last defense of the USD/CNH bulls before giving control to the bears.
On the flip side, USD/CNH run-up needs validation from the latest high of around 7.1788, as well as the 7.1800 round figure.
Following that, the 7.2000 psychological magnet may prod the pair buyers before directing them to the short-term rising channel’s top line, close to 7.2020.
Should the offshore Chinese Yuan (CNH) remains bearish past 7.2020, the odds of witnessing the pair’s rally towards the late November 2022 peak of near 7.2600 can’t be ruled out.
Trend: Pullback expected
Technical Levels: Supports and Resistances
USDCNH currently trading at 7.1714 at the time of writing. Pair opened at 7.1768 and is trading with a change of -0.08% % .
| Overview | Overview.1 | |
|---|---|---|
| 0 | Today last price | 7.1714 |
| 1 | Today Daily Change | -0.0054 |
| 2 | Today Daily Change % | -0.08% |
| 3 | Today daily open | 7.1768 |
The pair remains strongly bullish on the daily timeframe. It trades above its 20 SMA @ 7.0964, 50 SMA 6.988, 100 SMA @ 6.9258 and 200 SMA @ 6.9888.
| Trends | Trends.1 | |
|---|---|---|
| 0 | Daily SMA20 | 7.0964 |
| 1 | Daily SMA50 | 6.9880 |
| 2 | Daily SMA100 | 6.9258 |
| 3 | Daily SMA200 | 6.9888 |
The previous day high was 7.1788 while the previous day low was 7.1484. The daily 38.2% Fib levels comes at 7.1672, expected to provide support. Similarly, the daily 61.8% fib level is at 7.1601, expected to provide support.
Note the levels of interest below:
- Pivot support is noted at 7.1572, 7.1376, 7.1268
- Pivot resistance is noted at 7.1876, 7.1984, 7.218
| Levels | Levels.1 |
|---|---|
| Previous Daily High | 7.1788 |
| Previous Daily Low | 7.1484 |
| Previous Weekly High | 7.1558 |
| Previous Weekly Low | 7.1012 |
| Previous Monthly High | 7.1344 |
| Previous Monthly Low | 6.8962 |
| Daily Fibonacci 38.2% | 7.1672 |
| Daily Fibonacci 61.8% | 7.1601 |
| Daily Pivot Point S1 | 7.1572 |
| Daily Pivot Point S2 | 7.1376 |
| Daily Pivot Point S3 | 7.1268 |
| Daily Pivot Point R1 | 7.1876 |
| Daily Pivot Point R2 | 7.1984 |
| Daily Pivot Point R3 | 7.2180 |
[/s2If]
Nehcap Expert Advisor
The NEHCAP MT4 EA is high quality professional trading system geared to generate returns without using GRID or martingales. Each trade has strict risk per trade parameter. The pairs under management include EURUSD, GBPUSD, AUDCAD, AUDNZD,GBPAUD, EURAUD, EURCAD, CHFJPY and many more.
The system is trading live: LIVE ACCOUNT TRACKING
You can run it free. Apply for a free trial and track our account. Buy the system or use profit share mechanism to generate returns on your MT4.
Join Our Telegram Group
")


