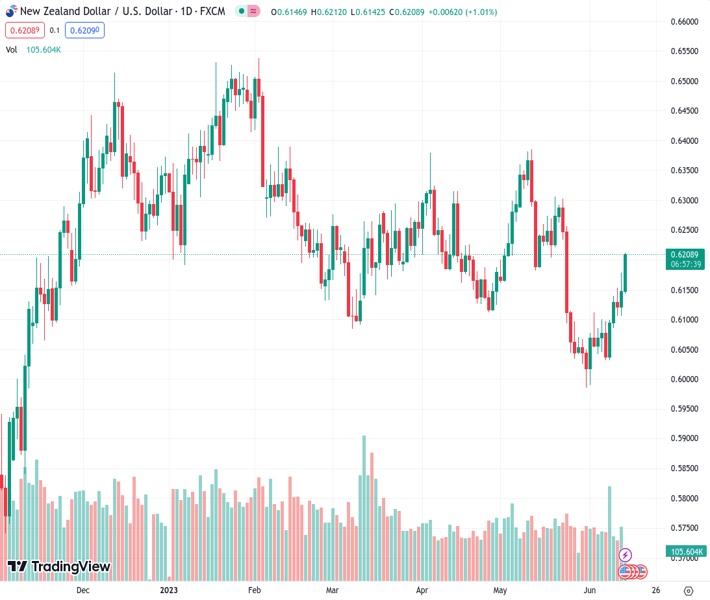
The NZDUSD is showing a significant increase to 0.6200, largely due to the sudden drop of the USD Index.
…
This is a premium post.
[s2If !current_user_can(access_s2member_level4)]Please register for FREE REGISTER to read full post below containing analysis. In case of any error or you think you are not able to read the full post below, please email us at support#nehcap.com [lwa][/s2If] [s2If current_user_can(access_s2member_level1)]
- NZD/USD has climbed strongly to 0.6200 as the USD Index has fallen like a house of cards.
The pair currently trades last at 0.62094.
The previous day high was 0.6178 while the previous day low was 0.6106. The daily 38.2% Fib levels comes at 0.615, expected to provide support. Similarly, the daily 61.8% fib level is at 0.6134, expected to provide support.
The NZD/USD pair has demonstrated a solid rally to the round-level resistance of 0.6200 as the US Dollar Index (DXY) has fallen like a house of cards. The Kiwi asset has been strengthened as May’s United States Producer Price Index (PPI) has cooled down due to lower gasoline prices.
S&P500 futures have surrendered the majority of gains added in Europe as investors are looking forward to the interest rate decision and the release of the dot plot by the Federal Reserve (Fed). US equities are losing their charm for the time being, however, its broader appeal is still solid as investors are extremely confident that a neutral stance will be taken by Fed chair Jerome Powell.
Analysts at Commerzbank cited Fed’s Powell may try his best to make a July hike seem likely. But I hope that the currency market is not so stupid as to overlook the obvious contradiction between words and deeds that this would create.
The USD Index has extended its downside journey to near 102.90 as firms have passed on the comfort of lower gasoline prices to end consumers by reducing prices of goods and services at factory gates. Monthly headline PPI has contracted by 0.3% in May while the street was anticipated a 0.1% contraction while core PPI has maintained its pace at 0.2% as expected by the market participants in the same period.
Softer US PPI has strengthened the demand for US government bonds, which has brought down 10-year US Treasury Yields to 3.78%.
Meanwhile, the New Zealand Dollar is going to heavily react to the Q1 Gross Domestic Product (GDP) data, which will be announced on Thursday. According to the preliminary report, Quarterly GDP is seen contracting by 0.1% against a prior contraction of 0.6%. On an annualized basis, the economic data is expected to expand by 2.6%, higher than the prior contraction of 2.2%.
Technical Levels: Supports and Resistances
NZDUSD currently trading at 0.6208 at the time of writing. Pair opened at 0.6149 and is trading with a change of 0.96 % .
| Overview | Overview.1 | |
|---|---|---|
| 0 | Today last price | 0.6208 |
| 1 | Today Daily Change | 0.0059 |
| 2 | Today Daily Change % | 0.9600 |
| 3 | Today daily open | 0.6149 |
The pair is trading above its 20 Daily moving average @ 0.6115, above its 50 Daily moving average @ 0.6182 , below its 100 Daily moving average @ 0.6226 and above its 200 Daily moving average @ 0.615
| Trends | Trends.1 | |
|---|---|---|
| 0 | Daily SMA20 | 0.6115 |
| 1 | Daily SMA50 | 0.6182 |
| 2 | Daily SMA100 | 0.6226 |
| 3 | Daily SMA200 | 0.6150 |
The previous day high was 0.6178 while the previous day low was 0.6106. The daily 38.2% Fib levels comes at 0.615, expected to provide support. Similarly, the daily 61.8% fib level is at 0.6134, expected to provide support.
Note the levels of interest below:
- Pivot support is noted at 0.6111, 0.6072, 0.6039
- Pivot resistance is noted at 0.6183, 0.6216, 0.6255
| Levels | Levels.1 |
|---|---|
| Previous Daily High | 0.6178 |
| Previous Daily Low | 0.6106 |
| Previous Weekly High | 0.6143 |
| Previous Weekly Low | 0.6026 |
| Previous Monthly High | 0.6385 |
| Previous Monthly Low | 0.5985 |
| Daily Fibonacci 38.2% | 0.6150 |
| Daily Fibonacci 61.8% | 0.6134 |
| Daily Pivot Point S1 | 0.6111 |
| Daily Pivot Point S2 | 0.6072 |
| Daily Pivot Point S3 | 0.6039 |
| Daily Pivot Point R1 | 0.6183 |
| Daily Pivot Point R2 | 0.6216 |
| Daily Pivot Point R3 | 0.6255 |
[/s2If]
Nehcap Expert Advisor
The NEHCAP MT4 EA is high quality professional trading system geared to generate returns without using GRID or martingales. Each trade has strict risk per trade parameter. The pairs under management include EURUSD, GBPUSD, AUDCAD, AUDNZD,GBPAUD, EURAUD, EURCAD, CHFJPY and many more.
The system is trading live: LIVE ACCOUNT TRACKING
You can run it free. Apply for a free trial and track our account. Buy the system or use profit share mechanism to generate returns on your MT4.
Join Our Telegram Group
")


