The NZDUSD at a rate of 0.61930 experiences a decrease of almost 40 pips due to the consecutive drop of the NZ GDP in two quarters.
…
This is a premium post.
[s2If !current_user_can(access_s2member_level4)]Please register for FREE REGISTER to read full post below containing analysis. In case of any error or you think you are not able to read the full post below, please email us at support#nehcap.com [lwa][/s2If] [s2If current_user_can(access_s2member_level1)]
- NZD/USD drops nearly 40 pips after NZ GDP drops for the second consecutive quarter.
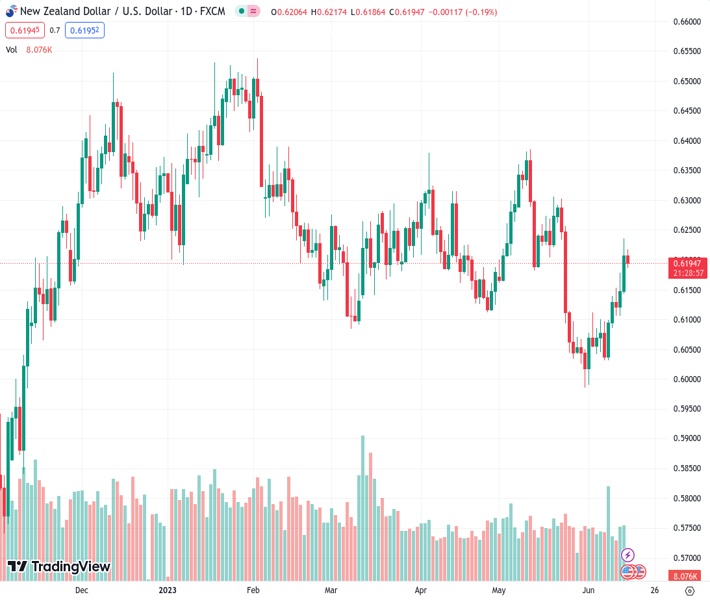
The pair currently trades last at 0.61930.
The previous day high was 0.6178 while the previous day low was 0.6106. The daily 38.2% Fib levels comes at 0.615, expected to provide support. Similarly, the daily 61.8% fib level is at 0.6134, expected to provide support.
NZD/USD bulls take a breather around 0.6200, easing from a three-week high, as New Zealand (NZ) statistics flag recession fears on early Thursday. That said, the Kiwi pair rose to the highest levels since May 24 before easing from 0.6235 the previous day on the US Federal Reserve’s (Fed) hawkish halt. However, the bears were impressed by the softer NZ first quarter (Q1) 2023 Gross Domestic Product (GDP) data.
New Zealand’s first quarter (Q1) 2023 Gross Domestic Product (GDP) matches the -0.1% QoQ forecast, versus -0.7% (revised) prior. Further details reveal that the yearly figures ease to 2.2% YoY for the said period versus 2.6% market expectations and 2.3% previous readings. Given the second consecutive negative quarterly growth figure, the Pacific nation flags a ‘technical’ recession.
On the other hand, Federal Open Market Committee (FOMC) decided to keep the benchmark Fed rate unchanged at the rate of 5.0-5.25%, matching market expectations of pausing the 1.5-year-old rate hike that propelled rates for 10 consecutive times. Even so, the hawkish signals from the FOMC Economic Projections and Fed Chair Powell’s speech underpin renew bullish bias about the US central bank.
The Fed details unveil that the dot plot rose 30 bps from March for 2024 and 2025 to 4.6% and 3.4% respectively while the median rate forecasts suggest two more rate increases in 2023. Further, no rate cuts nor recession is expected in the current year whereas the median estimation for the US GDP rose to 1.0% from 0.4% in March. Additionally, Powell’s speech unveils a “meeting by meeting” approach for decision-making but signals July as a ‘live’ meeting, suggesting a 0.25% rate hike.
Against this backdrop, the markets remained volatile on late Wednesday, as well as on early Thursday. As a result, Wall Street closed mixed whereas the US 10-year Treasury bond yield eased 1.0 basis point (bps) to 3.79% but its two-year counterpart grinds higher at the three-month top to 4.70%.
Moving on, China’s Retail Sales and Industrial Production for May will be more important to watch for the NZD/USD pair traders, especially amid fears of easing economic recovery in Australia’s key customer. Following that, the US Retail Sales for May will direct the Kiwi price.
Although the 100-DMA challenges the NZD/USD buyers around 0.6225, bears need validation from the previous resistance line stretched from early May, around 0.6135 at the latest, to retake control.
Technical Levels: Supports and Resistances
NZDUSD currently trading at 0.6194 at the time of writing. Pair opened at 0.6149 and is trading with a change of 0.73% % .
| Overview | Overview.1 | |
|---|---|---|
| 0 | Today last price | 0.6194 |
| 1 | Today Daily Change | 0.0045 |
| 2 | Today Daily Change % | 0.73% |
| 3 | Today daily open | 0.6149 |
The pair is trading above its 20 Daily moving average @ 0.6115, above its 50 Daily moving average @ 0.6182 , below its 100 Daily moving average @ 0.6226 and above its 200 Daily moving average @ 0.615
| Trends | Trends.1 | |
|---|---|---|
| 0 | Daily SMA20 | 0.6115 |
| 1 | Daily SMA50 | 0.6182 |
| 2 | Daily SMA100 | 0.6226 |
| 3 | Daily SMA200 | 0.6150 |
The previous day high was 0.6178 while the previous day low was 0.6106. The daily 38.2% Fib levels comes at 0.615, expected to provide support. Similarly, the daily 61.8% fib level is at 0.6134, expected to provide support.
Note the levels of interest below:
- Pivot support is noted at 0.6111, 0.6072, 0.6039
- Pivot resistance is noted at 0.6183, 0.6216, 0.6255
| Levels | Levels.1 |
|---|---|
| Previous Daily High | 0.6178 |
| Previous Daily Low | 0.6106 |
| Previous Weekly High | 0.6143 |
| Previous Weekly Low | 0.6026 |
| Previous Monthly High | 0.6385 |
| Previous Monthly Low | 0.5985 |
| Daily Fibonacci 38.2% | 0.6150 |
| Daily Fibonacci 61.8% | 0.6134 |
| Daily Pivot Point S1 | 0.6111 |
| Daily Pivot Point S2 | 0.6072 |
| Daily Pivot Point S3 | 0.6039 |
| Daily Pivot Point R1 | 0.6183 |
| Daily Pivot Point R2 | 0.6216 |
| Daily Pivot Point R3 | 0.6255 |
[/s2If]
Nehcap Expert Advisor
The NEHCAP MT4 EA is high quality professional trading system geared to generate returns without using GRID or martingales. Each trade has strict risk per trade parameter. The pairs under management include EURUSD, GBPUSD, AUDCAD, AUDNZD,GBPAUD, EURAUD, EURCAD, CHFJPY and many more.
The system is trading live: LIVE ACCOUNT TRACKING
You can run it free. Apply for a free trial and track our account. Buy the system or use profit share mechanism to generate returns on your MT4.
Join Our Telegram Group
")


