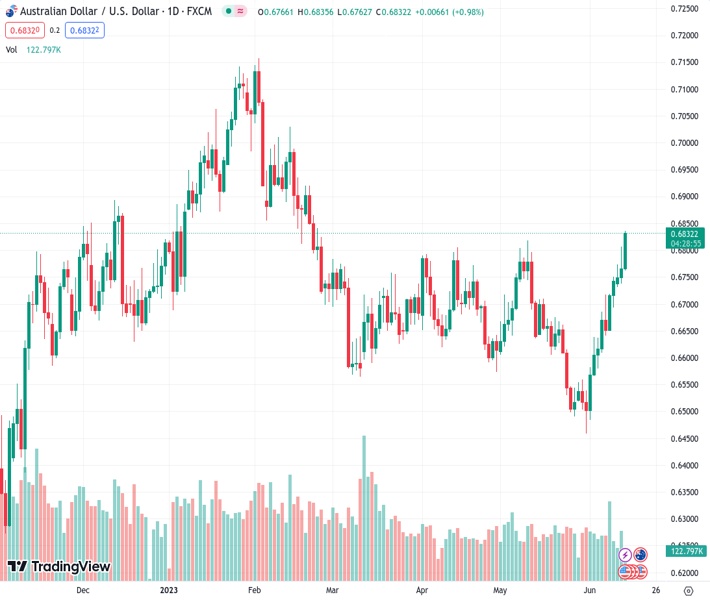
The AUDUSD pair has experienced a five-day consecutive surge, propelled by an unexpected increase in interest rates by the Reserve Bank of Australia (RBA) and a depreciation of the US Dollar (USD).
…
This is a premium post.
[s2If !current_user_can(access_s2member_level4)]Please register for FREE REGISTER to read full post below containing analysis. In case of any error or you think you are not able to read the full post below, please email us at support#nehcap.com [lwa][/s2If] [s2If current_user_can(access_s2member_level1)]
- AUD/USD climbs for five consecutive days, buoyed by a surprise rate hike from the Reserve Bank of Australia (RBA) and a weakening US Dollar (USD)
The pair currently trades last at 0.68349.
The previous day high was 0.6807 while the previous day low was 0.6738. The daily 38.2% Fib levels comes at 0.6781, expected to provide support. Similarly, the daily 61.8% fib level is at 0.6764, expected to provide support.
AUD/USD has climbed for five days, underpinned by the latest Reserve Bank of Australia (RBA) hike surprise and leaning toward a soft US Dollar (USD). That, alongside a risk-on impulse ahead of a possible Federal Reserve (Fed) pause, maintains the Aussie (AUD) rally. The AUD/USD exchanges hands at 0.6829, at new four-month highs, after dropping to a low of 0.6762.
A risk-on impulse is seen, with Wall Street registering gains. The Federal Reserve is expected to deliver a hawkish hold after measures of inflation showed signs of cooling but remained at levels twice the size of the Fed’s target.
The US Department of Labor revealed the Producer Price Index (PPI) for May came at 1.1% YoY below estimates, while the core reading rose by 2.8% YoY, lower than the 2.9% forecast. Although prices continued to be downtrend, core inflation remains stubbornly stickier than expected if we consider Tuesday’s core CPI above 5%.
The AUD/USD soared after the data release, breaking the 0.6800 figure and printing multi-month highs at around 0.6830s, while the greenback tumbled. The US Dollar Index (DXY), which measures the buck’s value vs. a basket of peers, falls 0.60%, at 102.688, its lowest level in four weeks.
In addition to revealing its monetary policy, the Fed will update economic projections and the dot plot. Analysts would scrutinize the reports looking for clues that the Fed is pausing its tightening cycle. Dovish surprises could be catastrophic for the buck and propel the AUD/USD toward the 0.69 handle.
On the Australian front, job data is eyed by AUD/USD traders. After a dismal report in April, the labor market is expected to remain solid, with the Aussie economy slashing 27,100 full-time jobs. A robust employment report would keep the RBA from easing policy until it remains confident the labor market is cooling down.
After cracking the 0.68 handle and the May 10 daily high of 0.6818, the AUD/USD distanced from the 200-day Exponential Moving Average (EMA), cementing its uptrend. But, Fed’s decision could rock the boat, and the five-day rally would put at risk buyers’ early gains. If the pair breaks below the 0.6800 figure, the AUD/USD could dip toward the 200-day EMA at 0.6755, but firstly must surpass the March 1 high at 0.6753. If those levels are broken, the AUD/USD subsequent sliding would be toward 0.6700. Conversely, the AUD/USD would extend its uptrend if it reclaims 0.6900, followed by the February 21 high at 0.6919.
Technical Levels: Supports and Resistances
AUDUSD currently trading at 0.6834 at the time of writing. Pair opened at 0.6767 and is trading with a change of 0.99 % .
| Overview | Overview.1 | |
|---|---|---|
| 0 | Today last price | 0.6834 |
| 1 | Today Daily Change | 0.0067 |
| 2 | Today Daily Change % | 0.9900 |
| 3 | Today daily open | 0.6767 |
The pair remains strongly bullish on the daily timeframe. It trades above its 20 SMA @ 0.6621, 50 SMA 0.6662, 100 SMA @ 0.6736 and 200 SMA @ 0.6691.
| Trends | Trends.1 | |
|---|---|---|
| 0 | Daily SMA20 | 0.6621 |
| 1 | Daily SMA50 | 0.6662 |
| 2 | Daily SMA100 | 0.6736 |
| 3 | Daily SMA200 | 0.6691 |
The previous day high was 0.6807 while the previous day low was 0.6738. The daily 38.2% Fib levels comes at 0.6781, expected to provide support. Similarly, the daily 61.8% fib level is at 0.6764, expected to provide support.
Note the levels of interest below:
- Pivot support is noted at 0.6734, 0.6702, 0.6665
- Pivot resistance is noted at 0.6803, 0.684, 0.6872
| Levels | Levels.1 |
|---|---|
| Previous Daily High | 0.6807 |
| Previous Daily Low | 0.6738 |
| Previous Weekly High | 0.6751 |
| Previous Weekly Low | 0.6579 |
| Previous Monthly High | 0.6818 |
| Previous Monthly Low | 0.6458 |
| Daily Fibonacci 38.2% | 0.6781 |
| Daily Fibonacci 61.8% | 0.6764 |
| Daily Pivot Point S1 | 0.6734 |
| Daily Pivot Point S2 | 0.6702 |
| Daily Pivot Point S3 | 0.6665 |
| Daily Pivot Point R1 | 0.6803 |
| Daily Pivot Point R2 | 0.6840 |
| Daily Pivot Point R3 | 0.6872 |
[/s2If]
Nehcap Expert Advisor
The NEHCAP MT4 EA is high quality professional trading system geared to generate returns without using GRID or martingales. Each trade has strict risk per trade parameter. The pairs under management include EURUSD, GBPUSD, AUDCAD, AUDNZD,GBPAUD, EURAUD, EURCAD, CHFJPY and many more.
The system is trading live: LIVE ACCOUNT TRACKING
You can run it free. Apply for a free trial and track our account. Buy the system or use profit share mechanism to generate returns on your MT4.
Join Our Telegram Group
")


