The AUDUSD pair at a rate of 0.67697 has attracted buyers, resulting in a slight increase in value to reach a monthly peak. This marks the fifth consecutive day of gains. However, it is anticipated that there will be a decline in the near future.
…
This is a premium post.
[s2If !current_user_can(access_s2member_level4)]Please register for FREE REGISTER to read full post below containing analysis. In case of any error or you think you are not able to read the full post below, please email us at support#nehcap.com [lwa][/s2If] [s2If current_user_can(access_s2member_level1)]
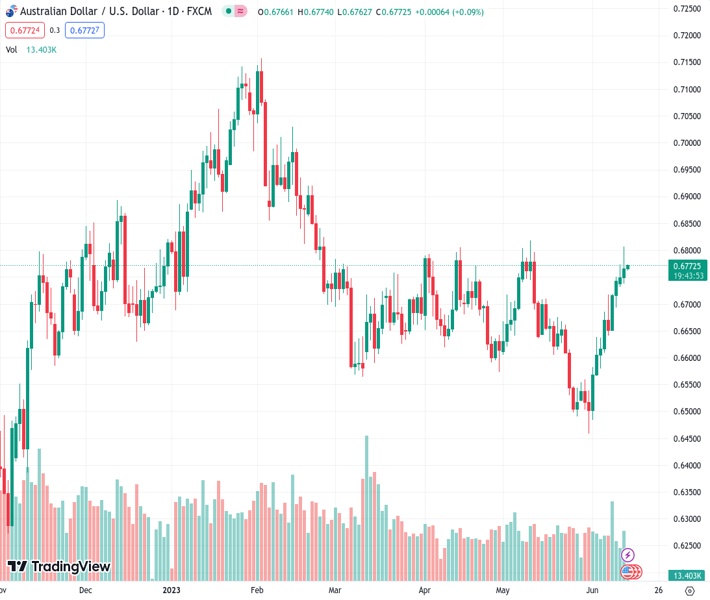
- AUD/USD picks up bids to print mild gains at monthly peak, up for the fifth consecutive day.
The pair currently trades last at 0.67697.
The previous day high was 0.6807 while the previous day low was 0.6738. The daily 38.2% Fib levels comes at 0.6781, expected to provide resistance. Similarly, the daily 61.8% fib level is at 0.6764, expected to provide support.
AUD/USD struggles to extend the latest upside momentum despite posting mild gains near 0.6770 amid the mid-Asian session on Wednesday.
In doing so, the Aussie pair defends the previous day’s upside break of a downward-sloping resistance line from February, now support, as well as the 200-day Exponential Moving Average (EMA). However, the market’s cautious mood ahead of the US Federal Reserve (Fed) announcements prods the bulls of late.
Also read: AUD/USD grinds higher past 0.6750 amid pre-Fed anxiety despite softer US inflation
It should be noted that the overbought RSI conditions and the 50% Fibonacci retracement level of the quote’s February-May downside, near 0.6810, quickly followed by the previous monthly peak of around 0.6820, also challenge the AUD/USD pair’s upside.
Hence, the Aussie pair remains unimportant for momentum traders till it trades between the resistance-turned-support and the previous monthly high, respectively around 0.6730 and 0.6820.
In a case where the Fed matches market forecasts and offers a hawkish halt, the AUD/USD can break the 0.6730 support, which in turn will open doors for the quote’s south-run towards the 23.6% Fibonacci retracement level, near 0.6620.
Meanwhile, the US central bank’s inability to please the policy hawks, mainly due to the recently downbeat US inflation, can propel the AUD/USD price past the 0.6820 hurdle. The same will allow the bulls to aim for the mid-February highs of near 0.7030.
However, the 61.8% Fibonacci retracement level surrounding 0.6890, also known as the golden ratio, will precede the 0.7000 psychological magnet to check the AUD/USD bulls on their way to the north.
Trend: Pullback expected
Technical Levels: Supports and Resistances
AUDUSD currently trading at 0.6768 at the time of writing. Pair opened at 0.6767 and is trading with a change of 0.01% % .
| Overview | Overview.1 | |
|---|---|---|
| 0 | Today last price | 0.6768 |
| 1 | Today Daily Change | 0.0001 |
| 2 | Today Daily Change % | 0.01% |
| 3 | Today daily open | 0.6767 |
The pair remains strongly bullish on the daily timeframe. It trades above its 20 SMA @ 0.6621, 50 SMA 0.6662, 100 SMA @ 0.6736 and 200 SMA @ 0.6691.
| Trends | Trends.1 | |
|---|---|---|
| 0 | Daily SMA20 | 0.6621 |
| 1 | Daily SMA50 | 0.6662 |
| 2 | Daily SMA100 | 0.6736 |
| 3 | Daily SMA200 | 0.6691 |
The previous day high was 0.6807 while the previous day low was 0.6738. The daily 38.2% Fib levels comes at 0.6781, expected to provide resistance. Similarly, the daily 61.8% fib level is at 0.6764, expected to provide support.
Note the levels of interest below:
- Pivot support is noted at 0.6734, 0.6702, 0.6665
- Pivot resistance is noted at 0.6803, 0.684, 0.6872
| Levels | Levels.1 |
|---|---|
| Previous Daily High | 0.6807 |
| Previous Daily Low | 0.6738 |
| Previous Weekly High | 0.6751 |
| Previous Weekly Low | 0.6579 |
| Previous Monthly High | 0.6818 |
| Previous Monthly Low | 0.6458 |
| Daily Fibonacci 38.2% | 0.6781 |
| Daily Fibonacci 61.8% | 0.6764 |
| Daily Pivot Point S1 | 0.6734 |
| Daily Pivot Point S2 | 0.6702 |
| Daily Pivot Point S3 | 0.6665 |
| Daily Pivot Point R1 | 0.6803 |
| Daily Pivot Point R2 | 0.6840 |
| Daily Pivot Point R3 | 0.6872 |
[/s2If]
Nehcap Expert Advisor
The NEHCAP MT4 EA is high quality professional trading system geared to generate returns without using GRID or martingales. Each trade has strict risk per trade parameter. The pairs under management include EURUSD, GBPUSD, AUDCAD, AUDNZD,GBPAUD, EURAUD, EURCAD, CHFJPY and many more.
The system is trading live: LIVE ACCOUNT TRACKING
You can run it free. Apply for a free trial and track our account. Buy the system or use profit share mechanism to generate returns on your MT4.
Join Our Telegram Group
")


