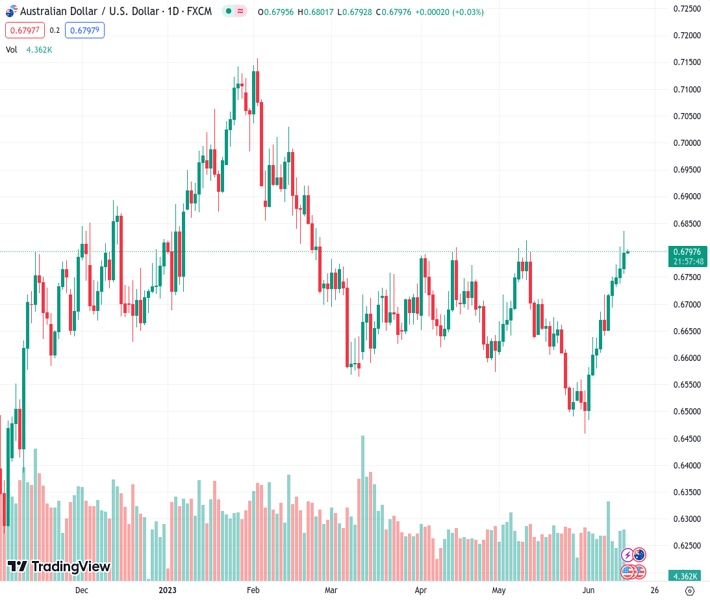
The AUDUSD has stabilized at the highest point since February, currently standing at 0.67976, following a day of fluctuations on Wednesday.
…
This is a premium post.
[s2If !current_user_can(access_s2member_level4)]Please register for FREE REGISTER to read full post below containing analysis. In case of any error or you think you are not able to read the full post below, please email us at support#nehcap.com [lwa][/s2If] [s2If current_user_can(access_s2member_level1)]
- AUD/USD steadies at the highest level since February after a volatile Wednesday.
The pair currently trades last at 0.67976.
The previous day high was 0.6807 while the previous day low was 0.6738. The daily 38.2% Fib levels comes at 0.6781, expected to provide support. Similarly, the daily 61.8% fib level is at 0.6764, expected to provide support.
AUD/USD makes rounds to 0.6800 as it portrays the Aussie pair trader’s anxiety ahead of multiple top-tier data releases from Australia and China during early Thursday. That said, the risk-barometer pair witnessed a volatile day on the Federal Reserve (Fed) announcements as it initially rose to the highest levels since February before retreating from 0.6835 amid hawkish signals from the US central bank.
Federal Open Market Committee (FOMC) decided to keep the benchmark Fed rate unchanged at the rate of 5.0-5.25%, matching market expectations of pausing the 1.5-year-old rate hike that propelled rates for 10 consecutive times. Even so, the hawkish signals from the FOMC Economic Projections and Fed Chair Powell’s speech underpin renew bullish bias about the US central bank.
That said, the dot plot rose 30 bps from March for 2024 and 2025 to 4.6% and 3.4% respectively while the median rate forecasts suggest two more rate increases in 2023. Further, no rate cuts nor recession is expected in the current year whereas the median estimation for the US Gross Domestic Product (GDP) rose to 1.0% from 0.4% in March. Additionally, Powell’s speech unveils a “meeting by meeting” approach for decision-making but signals July as a ‘live’ meeting, suggesting a 0.25% rate hike.
On Wednesday, there were no major data releases from Australia but optimism ahead of the Fed underpinned the AUD/USD pair’s bullish bias. That said, the US Producer Price Index (PPI) for May dropped to 1.1% YoY versus 1.5% expected and 2.6% prior
While portraying the market mood, Wall Street closed mixed whereas the US 10-year Treasury bond yield eased 1.0 basis point (bps) to 3.79% but its two-year counterpart grinds higher at the three-month top to 4.70%.
Looking forward, Australia’s Consumer Inflation Expectations for June will be the first data to direct the AUD/USD pair amid receding hawkish hopes from the Reserve Bank of Australia (RBA). Following that, May’s Aussie job numbers and RBA Bulleting for the first quarter (Q1) of 2023 can entertain the pair traders. Also important to watch will be China’s Retail Sales and Industrial Production for May, especially amid fears of easing economic recovery in Australia’s key customer.
Also read: Australian Employment Preview: Can the Aussie handle a slowdown in job creation?
Failure to provide a daily closing beyond May’s high of 0.6818 joins nearly overbought RSI (14) to challenge AUD/USD buyers.
Technical Levels: Supports and Resistances
AUDUSD currently trading at 0.68 at the time of writing. Pair opened at 0.6767 and is trading with a change of 0.49% % .
| Overview | Overview.1 | |
|---|---|---|
| 0 | Today last price | 0.68 |
| 1 | Today Daily Change | 0.0033 |
| 2 | Today Daily Change % | 0.49% |
| 3 | Today daily open | 0.6767 |
The pair remains strongly bullish on the daily timeframe. It trades above its 20 SMA @ 0.6621, 50 SMA 0.6662, 100 SMA @ 0.6736 and 200 SMA @ 0.6691.
| Trends | Trends.1 | |
|---|---|---|
| 0 | Daily SMA20 | 0.6621 |
| 1 | Daily SMA50 | 0.6662 |
| 2 | Daily SMA100 | 0.6736 |
| 3 | Daily SMA200 | 0.6691 |
The previous day high was 0.6807 while the previous day low was 0.6738. The daily 38.2% Fib levels comes at 0.6781, expected to provide support. Similarly, the daily 61.8% fib level is at 0.6764, expected to provide support.
Note the levels of interest below:
- Pivot support is noted at 0.6734, 0.6702, 0.6665
- Pivot resistance is noted at 0.6803, 0.684, 0.6872
| Levels | Levels.1 |
|---|---|
| Previous Daily High | 0.6807 |
| Previous Daily Low | 0.6738 |
| Previous Weekly High | 0.6751 |
| Previous Weekly Low | 0.6579 |
| Previous Monthly High | 0.6818 |
| Previous Monthly Low | 0.6458 |
| Daily Fibonacci 38.2% | 0.6781 |
| Daily Fibonacci 61.8% | 0.6764 |
| Daily Pivot Point S1 | 0.6734 |
| Daily Pivot Point S2 | 0.6702 |
| Daily Pivot Point S3 | 0.6665 |
| Daily Pivot Point R1 | 0.6803 |
| Daily Pivot Point R2 | 0.6840 |
| Daily Pivot Point R3 | 0.6872 |
[/s2If]
Nehcap Expert Advisor
The NEHCAP MT4 EA is high quality professional trading system geared to generate returns without using GRID or martingales. Each trade has strict risk per trade parameter. The pairs under management include EURUSD, GBPUSD, AUDCAD, AUDNZD,GBPAUD, EURAUD, EURCAD, CHFJPY and many more.
The system is trading live: LIVE ACCOUNT TRACKING
You can run it free. Apply for a free trial and track our account. Buy the system or use profit share mechanism to generate returns on your MT4.
Join Our Telegram Group
")


