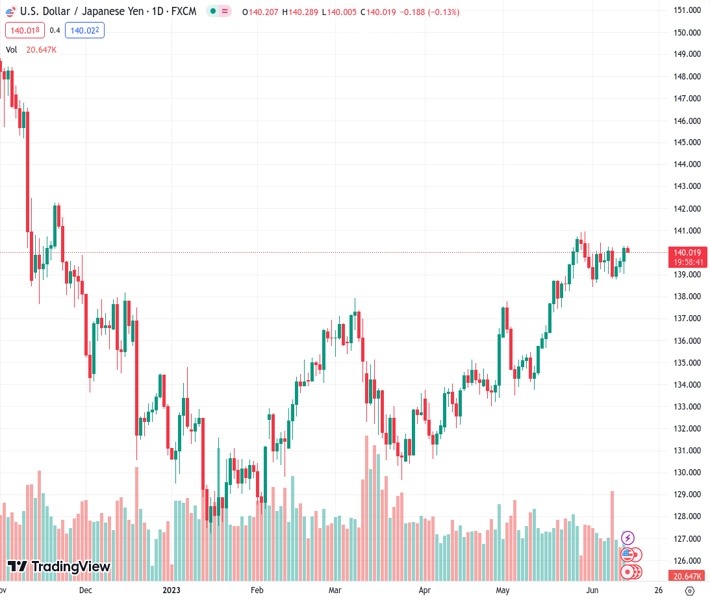
During Wednesday’s Asian trading session, the USDJPY experienced a slight decrease to 140.022, but did not continue to decline.
…
This is a premium post.
[s2If !current_user_can(access_s2member_level4)]Please register for FREE REGISTER to read full post below containing analysis. In case of any error or you think you are not able to read the full post below, please email us at support#nehcap.com [lwa][/s2If] [s2If current_user_can(access_s2member_level1)]
- USD/JPY ticks lower during the Asian session on Wednesday, albeit lacks follow-through.
The pair currently trades last at 140.022.
The previous day high was 140.31 while the previous day low was 139.01. The daily 38.2% Fib levels comes at 139.81, expected to provide support. Similarly, the daily 61.8% fib level is at 139.51, expected to provide support.
The USD/JPY pair is seen oscillating in a narrow trading band during the Asian session on Wednesday and consolidating its gains registered over the past three days. The pair is currently placed just above the 140.00 psychological mark as traders now seem to have moved to the sidelines and keenly await the outcome of the highly-anticipated FOMC policy meeting.
The Federal Reserve (Fed) is scheduled to announce its decision at 18:00 GMT later today and is widely expected to pause its year-long rate-hiking cycle. The bets were cemented by the latest US consumer inflation figures released on Tuesday, which showed that the Consumer Price Index (CPI) barely rose in May and the annual increase was the smallest in more than two years. In fact, the US Labor Department reported that the headline CPI edged higher by 0.1% during the reported month, following a 0.4% rise in April, marking the 11-straight month of cooling price pressures.
Over the 12 months through May, the CPI decelerated from 4.9% in April to 4.0% – the smallest year-on-year increase since March 2021. This, however, is still twice the Fed’s 2% target and could allow the Fed to stick to its hawkish stance. Apart from this, the fact that markets have been pricing in a greater chance of another 25 bps lift-off at the July FOMC meeting led to the overnight sharp spike in the US Treasury bond yields and is seen offering some support to the US Dollar (USD). This, in turn, should act as a tailwind for the USD/JPY pair and help limit any meaningful downfall.
Meanwhile, the market anxiety heading into the key central bank event risk is evident from a generally softer risk tone, which is seen benefitting the safe-haven Japanese Yen (JPY) and exerting some pressure on the major. However, expectations that the Bank of Japan (BoJ) will stick to its dovish stance to support the economy and ensure that the recent positive signs are sustained should keep a lid on JPY. This, in turn, warrants some caution before placing aggressive bearish bets around the USD/JPY pair and positioning for a deeper intraday corrective decline.
Technical Levels: Supports and Resistances
USDJPY currently trading at 140.07 at the time of writing. Pair opened at 140.22 and is trading with a change of -0.11 % .
| Overview | Overview.1 | |
|---|---|---|
| 0 | Today last price | 140.07 |
| 1 | Today Daily Change | -0.15 |
| 2 | Today Daily Change % | -0.11 |
| 3 | Today daily open | 140.22 |
The pair remains strongly bullish on the daily timeframe. It trades above its 20 SMA @ 139.38, 50 SMA 136.37, 100 SMA @ 134.69 and 200 SMA @ 137.28.
| Trends | Trends.1 | |
|---|---|---|
| 0 | Daily SMA20 | 139.38 |
| 1 | Daily SMA50 | 136.37 |
| 2 | Daily SMA100 | 134.69 |
| 3 | Daily SMA200 | 137.28 |
The previous day high was 140.31 while the previous day low was 139.01. The daily 38.2% Fib levels comes at 139.81, expected to provide support. Similarly, the daily 61.8% fib level is at 139.51, expected to provide support.
Note the levels of interest below:
- Pivot support is noted at 139.39, 138.55, 138.09
- Pivot resistance is noted at 140.68, 141.14, 141.98
| Levels | Levels.1 |
|---|---|
| Previous Daily High | 140.31 |
| Previous Daily Low | 139.01 |
| Previous Weekly High | 140.45 |
| Previous Weekly Low | 138.76 |
| Previous Monthly High | 140.93 |
| Previous Monthly Low | 133.50 |
| Daily Fibonacci 38.2% | 139.81 |
| Daily Fibonacci 61.8% | 139.51 |
| Daily Pivot Point S1 | 139.39 |
| Daily Pivot Point S2 | 138.55 |
| Daily Pivot Point S3 | 138.09 |
| Daily Pivot Point R1 | 140.68 |
| Daily Pivot Point R2 | 141.14 |
| Daily Pivot Point R3 | 141.98 |
[/s2If]
Nehcap Expert Advisor
The NEHCAP MT4 EA is high quality professional trading system geared to generate returns without using GRID or martingales. Each trade has strict risk per trade parameter. The pairs under management include EURUSD, GBPUSD, AUDCAD, AUDNZD,GBPAUD, EURAUD, EURCAD, CHFJPY and many more.
The system is trading live: LIVE ACCOUNT TRACKING
You can run it free. Apply for a free trial and track our account. Buy the system or use profit share mechanism to generate returns on your MT4.
Join Our Telegram Group
")


