WTI has rebounded and is currently being traded at $69.44 per barrel following the release of the US inflation report.
…
This is a premium post.
[s2If !current_user_can(access_s2member_level4)]Please register for FREE REGISTER to read full post below containing analysis. In case of any error or you think you are not able to read the full post below, please email us at support#nehcap.com [lwa][/s2If] [s2If current_user_can(access_s2member_level1)]
- WTI recovers, trading at $69.44 per barrel following the US inflation report.
The pair currently trades last at 69.63.
The previous day high was 70.58 while the previous day low was 66.95. The daily 38.2% Fib levels comes at 68.34, expected to provide support. Similarly, the daily 61.8% fib level is at 69.19, expected to provide support.
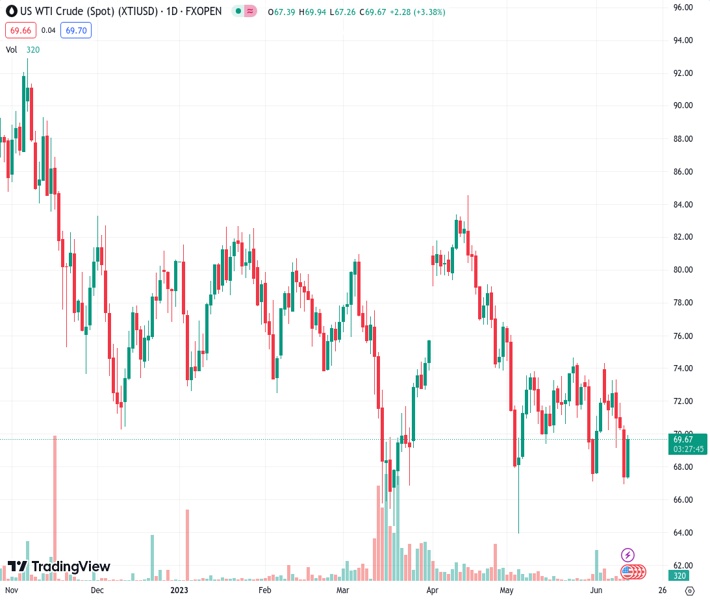
Western Texas Intermediate (WTI), the US crude oil benchmark, recovered some ground due to a softer US Dollar (USD) following the May inflation report in the United States (US). At the time of writing, WTI is trading at $69.49 per barrel, a gain of more than 3%.
Oil prices are pairing some of its Monday losses due to several factors. Firstly, a US inflation report from the US Department of Labor justifies the Federal Reserve’s (Fed) stance to pause its tightening cycle, as the Consumer Price Index (CPI) rose by 4% YoY, below forecasts and the prior month’s reading. In comparison, core CPI expanded by 5.3% YoY, below April’s data, aligned with estimates.
That weakened the greenback as traders speculated about a less aggressive Fed. The US Dollar Index (DXY) trades with losses of 0.40%, at around three-week lows of 103.212.
Meanwhile, the People’s Bank of China (PBoC) cut rates on its lending rate for the first time in 10 months, aimed to stimulate China’s economy, which failed to gain momentum after lifting the Covid-19 zero-tolerance restrictions. That sparked a rise in WTI price, as China, the largest crude importer, would likely increase oil demand.
That, alongside Saudi Arabia proposed crude output cut to kick in the next month, cushioned Monday’s losses and bolstered WTI price towards the $70.00 per barrel mark.
Nevertheless, a recent report by the Organization of Petroleum Exporting Countries and its allies, OPEC+, held that demand will remain steady despite slowing growth. However, it noted that Saudi Arabia’s cuts would tighten the global market in July.
Further data related to oil is expected, with the International Energy Agency (IEA) will release its latest projections, while the American Petroleum Institute (API) is scheduled to unveil its estimates of US crude oil.
Technical Levels: Supports and Resistances
XTIUSD currently trading at 69.63 at the time of writing. Pair opened at 67.48 and is trading with a change of 3.19 % .
| Overview | Overview.1 | |
|---|---|---|
| 0 | Today last price | 69.63 |
| 1 | Today Daily Change | 2.15 |
| 2 | Today Daily Change % | 3.19 |
| 3 | Today daily open | 67.48 |
The pair remains strongly bearish on the daily time frame. It trades below the 20 SMA @ 71.46, 50 SMA 74.5, 100 SMA @ 75.14 and 200 SMA @ 78.48.
| Trends | Trends.1 | |
|---|---|---|
| 0 | Daily SMA20 | 71.46 |
| 1 | Daily SMA50 | 74.50 |
| 2 | Daily SMA100 | 75.14 |
| 3 | Daily SMA200 | 78.48 |
The previous day high was 70.58 while the previous day low was 66.95. The daily 38.2% Fib levels comes at 68.34, expected to provide support. Similarly, the daily 61.8% fib level is at 69.19, expected to provide support.
Note the levels of interest below:
- Pivot support is noted at 66.1, 64.71, 62.47
- Pivot resistance is noted at 69.72, 71.96, 73.34
| Levels | Levels.1 |
|---|---|
| Previous Daily High | 70.58 |
| Previous Daily Low | 66.95 |
| Previous Weekly High | 74.36 |
| Previous Weekly Low | 69.17 |
| Previous Monthly High | 76.61 |
| Previous Monthly Low | 64.31 |
| Daily Fibonacci 38.2% | 68.34 |
| Daily Fibonacci 61.8% | 69.19 |
| Daily Pivot Point S1 | 66.10 |
| Daily Pivot Point S2 | 64.71 |
| Daily Pivot Point S3 | 62.47 |
| Daily Pivot Point R1 | 69.72 |
| Daily Pivot Point R2 | 71.96 |
| Daily Pivot Point R3 | 73.34 |
[/s2If]
Nehcap Expert Advisor
The NEHCAP MT4 EA is high quality professional trading system geared to generate returns without using GRID or martingales. Each trade has strict risk per trade parameter. The pairs under management include EURUSD, GBPUSD, AUDCAD, AUDNZD,GBPAUD, EURAUD, EURCAD, CHFJPY and many more.
The system is trading live: LIVE ACCOUNT TRACKING
You can run it free. Apply for a free trial and track our account. Buy the system or use profit share mechanism to generate returns on your MT4.
Join Our Telegram Group
")


