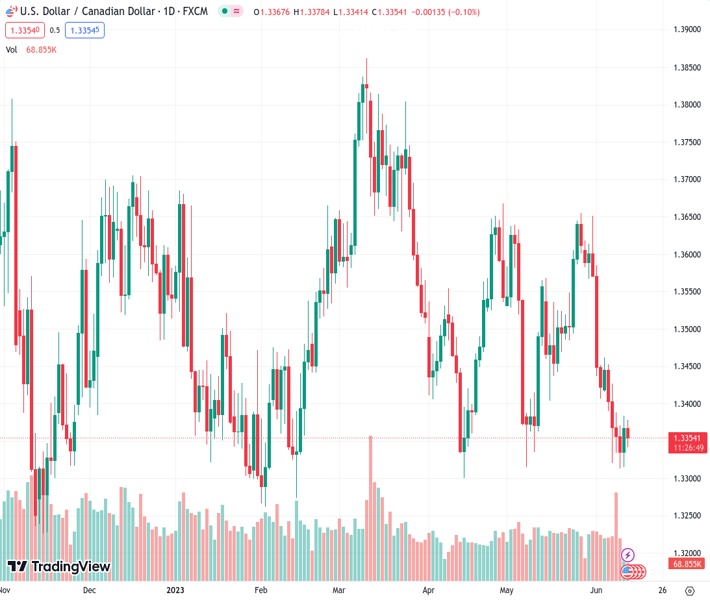
The USDCAD pair, trading at 1.33542, has experienced a recovery from its previous rate of 1.3340 following the detection of moderate steadiness in the cost of oil.
…
This is a premium post.
[s2If !current_user_can(access_s2member_level4)]Please register for FREE REGISTER to read full post below containing analysis. In case of any error or you think you are not able to read the full post below, please email us at support#nehcap.com [lwa][/s2If] [s2If current_user_can(access_s2member_level1)]
- USD/CAD has rebounded from 1.3340 after sensing intermediate stability in the oil price.
The pair currently trades last at 1.33542.
The previous day high was 1.3384 while the previous day low was 1.3315. The daily 38.2% Fib levels comes at 1.3357, expected to provide resistance. Similarly, the daily 61.8% fib level is at 1.3341, expected to provide support.
The USD/CAD pair has shown a solid recovery move from 1.3340 in the European session. The Loonie asset has got some strength as the oil price has shown some stability after a sheer sell-off to near $67.00. Also, the US Dollar Index (DXY) is making efforts in defending its immediate support of 103.20 but still looks vulnerable.
S&P500 futures have generated significant gains in Europe as the Federal Reserve (Fed) is expected to sound neutral on interest rate policy while delivering its monetary policy statement. The USD Index is struggling to keep its auction above 103.20 as the risk appetite theme has trimmed its appeal.
Later in the day, the United States Consumer Price Index (CPI) data (May) will be of utmost importance. Analysts at Credit Suisse expect the core CPI inflation to decline to 0.3% MoM in May, a welcome step lower after five consecutive months of registering 0.4% MoM. The YoY reading is likely to decline to 5.2%. Headline inflation is likely to decline to 0.1% MoM.
The effect of a weak USD Index can also be seen in US Treasury yields. The yields offered on 10-year US Treasury bonds have dropped to near 3.72%.
Meanwhile, the Canadian Dollar is showing resilience as investors are hoping that the Bank of Canada (BoC) will raise interest rates again to tighten its grip over stubborn inflation. Recent Canadian Employment data remained weak and posted a higher Unemployment Rate than expected after a few months. The street believes that a one-time weakness in the Employment numbers is insufficient to force BoC Governor Tiff Macklem to turn neutral again.
On the oil front, oil prices were heavily sold as Eurozone has joined China and is expected to show poor demand ahead due to deepening fears of recession. It is worth noting that Canada is the leading exporter of oil to the United States and lower oil prices would impact the Canadian Dollar.
Technical Levels: Supports and Resistances
USDCAD currently trading at 1.3352 at the time of writing. Pair opened at 1.3368 and is trading with a change of -0.12 % .
| Overview | Overview.1 | |
|---|---|---|
| 0 | Today last price | 1.3352 |
| 1 | Today Daily Change | -0.0016 |
| 2 | Today Daily Change % | -0.1200 |
| 3 | Today daily open | 1.3368 |
The pair remains strongly bearish on the daily time frame. It trades below the 20 SMA @ 1.3487, 50 SMA 1.3486, 100 SMA @ 1.3515 and 200 SMA @ 1.3515.
| Trends | Trends.1 | |
|---|---|---|
| 0 | Daily SMA20 | 1.3487 |
| 1 | Daily SMA50 | 1.3486 |
| 2 | Daily SMA100 | 1.3515 |
| 3 | Daily SMA200 | 1.3515 |
The previous day high was 1.3384 while the previous day low was 1.3315. The daily 38.2% Fib levels comes at 1.3357, expected to provide resistance. Similarly, the daily 61.8% fib level is at 1.3341, expected to provide support.
Note the levels of interest below:
- Pivot support is noted at 1.3327, 1.3287, 1.3259
- Pivot resistance is noted at 1.3396, 1.3424, 1.3465
| Levels | Levels.1 |
|---|---|
| Previous Daily High | 1.3384 |
| Previous Daily Low | 1.3315 |
| Previous Weekly High | 1.3462 |
| Previous Weekly Low | 1.3313 |
| Previous Monthly High | 1.3655 |
| Previous Monthly Low | 1.3315 |
| Daily Fibonacci 38.2% | 1.3357 |
| Daily Fibonacci 61.8% | 1.3341 |
| Daily Pivot Point S1 | 1.3327 |
| Daily Pivot Point S2 | 1.3287 |
| Daily Pivot Point S3 | 1.3259 |
| Daily Pivot Point R1 | 1.3396 |
| Daily Pivot Point R2 | 1.3424 |
| Daily Pivot Point R3 | 1.3465 |
[/s2If]
Nehcap Expert Advisor
The NEHCAP MT4 EA is high quality professional trading system geared to generate returns without using GRID or martingales. Each trade has strict risk per trade parameter. The pairs under management include EURUSD, GBPUSD, AUDCAD, AUDNZD,GBPAUD, EURAUD, EURCAD, CHFJPY and many more.
The system is trading live: LIVE ACCOUNT TRACKING
You can run it free. Apply for a free trial and track our account. Buy the system or use profit share mechanism to generate returns on your MT4.
Join Our Telegram Group
")


