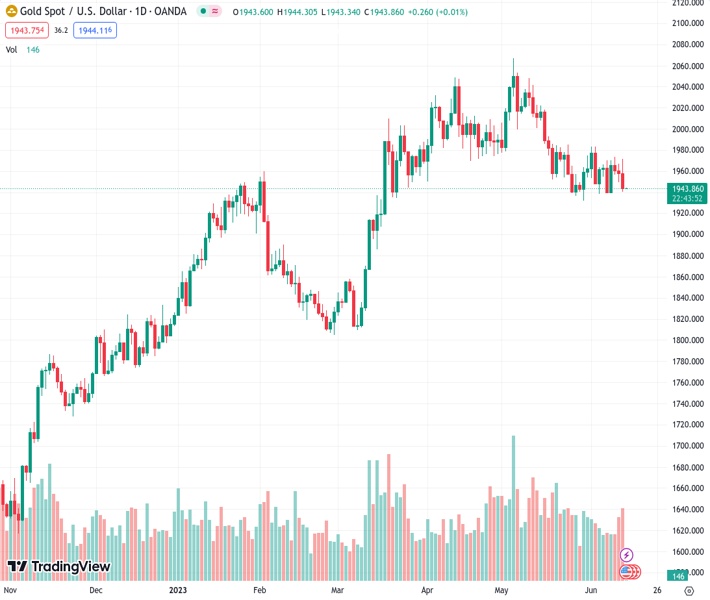
The price of gold, currently at 1,943.76 for XAUUSD, remains low as it has been trapped within a symmetrical triangle for two weeks. The recent three-day decline has added to the pressure, and as per the analysis by Nehcap, it is anticipated that there may be further decline in the near future.
…
This is a premium post.
[s2If !current_user_can(access_s2member_level4)]Please register for FREE REGISTER to read full post below containing analysis. In case of any error or you think you are not able to read the full post below, please email us at support#nehcap.com [lwa][/s2If] [s2If current_user_can(access_s2member_level1)]
- Gold Price stays depressed within fortnight-long symmetrical triangle, pressured after three-day losing streak.
The pair currently trades last at 1943.76.
The previous day high was 1967.05 while the previous day low was 1949.26. The daily 38.2% Fib levels comes at 1956.06, expected to provide resistance. Similarly, the daily 61.8% fib level is at 1960.25, expected to provide resistance.
Gold Price (XAU/USD) remains on the back foot around the lowest level in a week, challenging bearish breakdown of the trend continuation chart pattern, suggesting further downside of the XAU/USD. That said, the Gold Price holds lower grounds near $1,943 amid early Wednesday morning in Asia. It should be noted that the precious metal’s latest weakness pays little heed to the downbeat United States (US) inflation readings while appears closely (inversely) linked to the firmer US Treasury bond yields.
Gold Price teases technical breakdown of a short-term symmetrical triangle, signaling further downside of the XAU/USD, even as the US inflation numbers match market forecasts. The reason could be linked to the upbeat US Treasury bond yields and China related news.
On Tuesday, the US inflation data came in mixed for May but managed to please the US Dollar buyers. That said, the headline Consumer Price Index (CPI) drops more-than-expected and prior releases to 0.1% MoM and 4.0% YoY. However, the Core CPI, known as the CPI ex Food & Energy, matches 0.4% monthly and 5.3% yearly forecasts. It’s worth noting that the US headline CPI dropped to the lowest since March 2021 and hence justify the market’s expectations of the US Federal Reserve (Fed) hawkish halt, which in turn should weigh on the US Dollar and allow the Gold Price to grind higher.
That said, the CME’s FedWatch Tool suggests more than 70% chance of the US Federal Reserve’s (Fed) no rate hike during today’s monetary policy meeting. With this, the US Dollar Index (DXY) dropped to the lowest levels in three weeks, taking the Gold Price down with it, before bouncing off 103.05.
While the US Dollar dropped on downbeat United States inflation but couldn’t impress the Gold Price buyers, the reason could be linked to the mixed catalysts surrounding China and the upbeat Treasury yields, as well as the pre-Fed positioning.
People’s Bank of China (PBoC) cuts the Repo Rate to 1.9% from 2.0% and confirms the previous fears suggesting slower economic growth in the world’s biggest industrial player. With this in mind, Bloomberg said, “China’s central bank cut a short-term policy interest rate, easing its monetary stance to help aid the economy’s recovery.”
Elsewhere, the latest fears of the stiff US-China tension also should have weighed on the Gold Price. On Monday, the US expands its ban on imports from Xinjiang. China vows to protect China firms against any US sanctions, per Reuters. Following that, Bloomberg released prepared remarks of US Treasury Secretary Janet Yellen’s scheduled Testimony in front of the House Financial Services Committee as she said that the International Monetary Fund (IMF) and the World Bank (WB) serve as important counterweights to non-transparent, unsustainable lending from others, like China.
Amid these plays, Wall Street cheered downbeat US inflation and hopes of no rate hike from the Fed but the US Treasury bond yields remain firmer. That said, the US 10-year Treasury bond yields rose to a 13-day high of 3.83% whereas the two-year counterpart poked the highest levels in three months with 4.70% mark before easing to 4.67% in the last hours. With this, the market’s demand for bonds and risk-on seemed to have weighed on the Gold Price. However, it all depends upon the Federal Reserve (Fed) for a clear direction.
Although the recently firmer yields join the downbeat US inflation to weigh on the Gold Price, the XAU/USD move appears unconvincing amid the softer US Dollar. Hence, even if the Fed’s status-quo is almost given, the Gold traders will pay attention to the US central bank’s economic forecasts, dot-plot and Chairman Jerome Powell’s press conference for clear directions. The same can keep the Gold bears on the board in case of a hawkish halt, which is more likely.
Also read: Gold Price Forecast: XAU/USD bearish as US CPI fuels optimism
Gold Price remains on the back foot as it prods the bottom line of a two-week-old symmetrical triangle.
That said, the below 50.0 level of the Relative Strength Index (RSI) placed at 14, suggests bottom-picking of the XAU/USD from the triangle’s lower line, around $1,942 at the latest.
The following recovery, however, remains elusive unless the Gold Price remains below the stated trend-continuation chart pattern’s top, close to $1,969 by the press time.
Even if the quote Gold Price crosses the $1,969 hurdle, the 200-SMA and a three-week-old horizontal resistance zone, near $1,983-85, will be a tough nut to crack for the bulls before taking control. Also acting as an upside filter is the $2,000, a break of which will welcome the XAU/USD buyers with open hands and a pass to prod the $2,050 hurdle.
On the flip side, the XAU/USD’s break of the triangle’s support of near $1,942 can quickly challenge the yearly low marked in May around $1,932.
Following that, the 61.8% Fibonacci Expansion (FE) of its May 10 to June 02 moves, near $1,910, will precede the $1,900 round figure to act as the final defenses of the Gold buyers.
Overall, stronger resistance on the top and a likely hawkish Fed rate halt keep the Gold sellers hopeful.
Trend: Further weakness expected
Technical Levels: Supports and Resistances
XAUUSD currently trading at 1943.76 at the time of writing. Pair opened at 1957.86 and is trading with a change of -0.72% % .
| Overview | Overview.1 | |
|---|---|---|
| 0 | Today last price | 1943.76 |
| 1 | Today Daily Change | -14.10 |
| 2 | Today Daily Change % | -0.72% |
| 3 | Today daily open | 1957.86 |
The pair is trading below its 20 Daily moving average @ 1962.01, below its 50 Daily moving average @ 1989.95 , above its 100 Daily moving average @ 1941.51 and above its 200 Daily moving average @ 1842.83
| Trends | Trends.1 | |
|---|---|---|
| 0 | Daily SMA20 | 1962.01 |
| 1 | Daily SMA50 | 1989.95 |
| 2 | Daily SMA100 | 1941.51 |
| 3 | Daily SMA200 | 1842.83 |
The previous day high was 1967.05 while the previous day low was 1949.26. The daily 38.2% Fib levels comes at 1956.06, expected to provide resistance. Similarly, the daily 61.8% fib level is at 1960.25, expected to provide resistance.
Note the levels of interest below:
- Pivot support is noted at 1949.06, 1940.27, 1931.27
- Pivot resistance is noted at 1966.85, 1975.85, 1984.64
| Levels | Levels.1 |
|---|---|
| Previous Daily High | 1967.05 |
| Previous Daily Low | 1949.26 |
| Previous Weekly High | 1973.15 |
| Previous Weekly Low | 1938.15 |
| Previous Monthly High | 2079.76 |
| Previous Monthly Low | 1932.12 |
| Daily Fibonacci 38.2% | 1956.06 |
| Daily Fibonacci 61.8% | 1960.25 |
| Daily Pivot Point S1 | 1949.06 |
| Daily Pivot Point S2 | 1940.27 |
| Daily Pivot Point S3 | 1931.27 |
| Daily Pivot Point R1 | 1966.85 |
| Daily Pivot Point R2 | 1975.85 |
| Daily Pivot Point R3 | 1984.64 |
[/s2If]
Nehcap Expert Advisor
The NEHCAP MT4 EA is high quality professional trading system geared to generate returns without using GRID or martingales. Each trade has strict risk per trade parameter. The pairs under management include EURUSD, GBPUSD, AUDCAD, AUDNZD,GBPAUD, EURAUD, EURCAD, CHFJPY and many more.
The system is trading live: LIVE ACCOUNT TRACKING
You can run it free. Apply for a free trial and track our account. Buy the system or use profit share mechanism to generate returns on your MT4.
Join Our Telegram Group
")


