The GBPUSD pair at 1.26070 is pulling back from its peak levels in five weeks due to the upcoming monthly data release in the UK and the Fed’s decision. @nehcap predicts that the downside will be minimal.
…
This is a premium post.
[s2If !current_user_can(access_s2member_level4)]Please register for FREE REGISTER to read full post below containing analysis. In case of any error or you think you are not able to read the full post below, please email us at support#nehcap.com [lwa][/s2If] [s2If current_user_can(access_s2member_level1)]
- GBP/USD retreats from the highest levels in five weeks as UK monthly data dump, Fed decision loom.
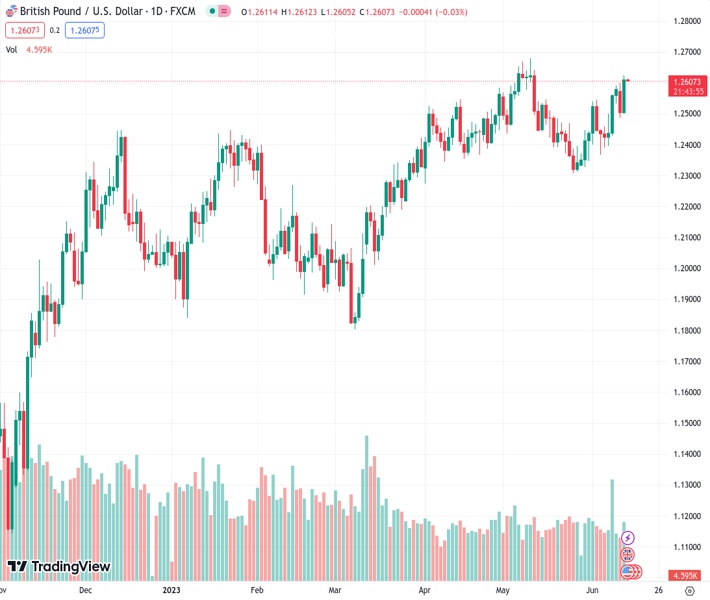
The pair currently trades last at 1.26070.
The previous day high was 1.2599 while the previous day low was 1.2487. The daily 38.2% Fib levels comes at 1.253, expected to provide support. Similarly, the daily 61.8% fib level is at 1.2557, expected to provide support.
GBP/USD fades upside momentum at a multi-day high on the key day comprising the US Federal Reserve (Fed) verdict and the monthly UK data dump. That said, the Cable pair remains dicey near 1.2600 after rising the most in a week to prod the highest level since May 11 the previous day. Apart from the pre-data/event anxiety, the Pound Sterling also justifies the technical clues to tease the sellers on important data.
That said, overbought RSI conditions and an ascending resistance line from June 01, around 1.2615 by the press time, are the first-tier challenges for the GBP/USD bulls. Also restricting the Cable pair’s upside is the Doji candlestick on the four-hour play marked at the multi-day high, suggesting a pullback in prices.
Hence, the quote is likely to consolidate the latest gains, which in turn highlights the 61.8% Fibonacci retracement level of its May month fall, around 1.2535. It’s worth noting that the said technical level is also known as the golden Fibonacci ratio.
In a case where the GBP/USD drops below the said key Fibonacci support, it can fall to the 50% Fibonacci retracement near the 1.2500 round figure.
It should be noted, however, that the bullish MACD may join the 200-SMA level of 1.2485 to challenge the Cable bears afterward.
On the contrary, a clear upside past the latest peak of near 1.2625 could defy the bearish bias and propel the GBP/USD price towards challenging the previous monthly high of around 1.2680.
Trend: Limited downside expected
Technical Levels: Supports and Resistances
GBPUSD currently trading at 1.261 at the time of writing. Pair opened at 1.2505 and is trading with a change of 0.84% % .
| Overview | Overview.1 | |
|---|---|---|
| 0 | Today last price | 1.261 |
| 1 | Today Daily Change | 0.0105 |
| 2 | Today Daily Change % | 0.84% |
| 3 | Today daily open | 1.2505 |
The pair remains strongly bullish on the daily timeframe. It trades above its 20 SMA @ 1.2442, 50 SMA 1.2471, 100 SMA @ 1.231 and 200 SMA @ 1.2021.
| Trends | Trends.1 | |
|---|---|---|
| 0 | Daily SMA20 | 1.2442 |
| 1 | Daily SMA50 | 1.2471 |
| 2 | Daily SMA100 | 1.2310 |
| 3 | Daily SMA200 | 1.2021 |
The previous day high was 1.2599 while the previous day low was 1.2487. The daily 38.2% Fib levels comes at 1.253, expected to provide support. Similarly, the daily 61.8% fib level is at 1.2557, expected to provide support.
Note the levels of interest below:
- Pivot support is noted at 1.2462, 1.2418, 1.2349
- Pivot resistance is noted at 1.2574, 1.2643, 1.2686
| Levels | Levels.1 |
|---|---|
| Previous Daily High | 1.2599 |
| Previous Daily Low | 1.2487 |
| Previous Weekly High | 1.2590 |
| Previous Weekly Low | 1.2369 |
| Previous Monthly High | 1.2680 |
| Previous Monthly Low | 1.2308 |
| Daily Fibonacci 38.2% | 1.2530 |
| Daily Fibonacci 61.8% | 1.2557 |
| Daily Pivot Point S1 | 1.2462 |
| Daily Pivot Point S2 | 1.2418 |
| Daily Pivot Point S3 | 1.2349 |
| Daily Pivot Point R1 | 1.2574 |
| Daily Pivot Point R2 | 1.2643 |
| Daily Pivot Point R3 | 1.2686 |
[/s2If]
Nehcap Expert Advisor
The NEHCAP MT4 EA is high quality professional trading system geared to generate returns without using GRID or martingales. Each trade has strict risk per trade parameter. The pairs under management include EURUSD, GBPUSD, AUDCAD, AUDNZD,GBPAUD, EURAUD, EURCAD, CHFJPY and many more.
The system is trading live: LIVE ACCOUNT TRACKING
You can run it free. Apply for a free trial and track our account. Buy the system or use profit share mechanism to generate returns on your MT4.
Join Our Telegram Group
")


