The currency pair USDCHF is currently being traded at the rate of 0.9058. It is facing resistance on the upper end at 0.9117/20 while the convergence of the 50 and 20-day EMAs at 0.9041 and 0.9039 is capping its downside movements.
…
This is a premium post.
[s2If !current_user_can(access_s2member_level4)]Please register for FREE REGISTER to read full post below containing analysis. In case of any error or you think you are not able to read the full post below, please email us at support#nehcap.com [lwa][/s2If] [s2If current_user_can(access_s2member_level1)]
- USD/CHF trades at 0.9058, capped on the topside by 0.9117/20; on the downside by the confluence of the 50 and 20-day EMAs at 0.9041 and 0.9039.
The pair currently trades last at 0.90590.
The previous day high was 0.9109 while the previous day low was 0.9016. The daily 38.2% Fib levels comes at 0.9074, expected to provide resistance. Similarly, the daily 61.8% fib level is at 0.9051, expected to provide support.
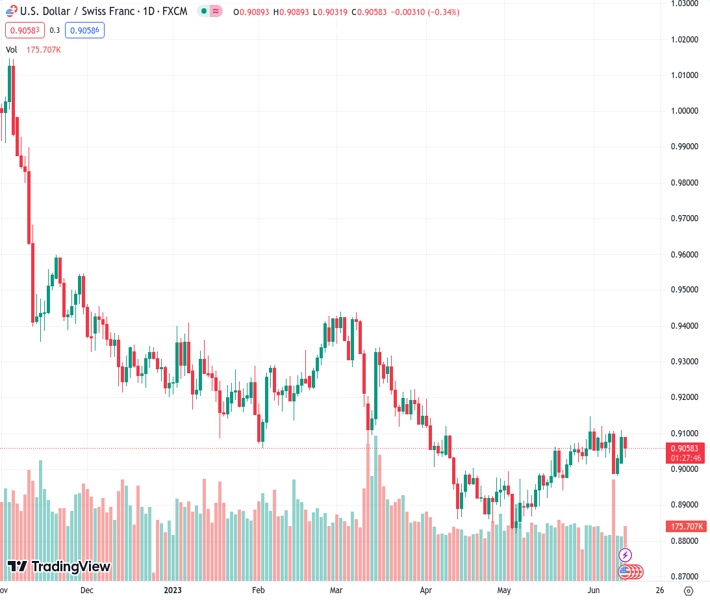
USD/CHF halts its rally to just two days, retraces from weekly highs reached on Monday at 0.9109, shy of testing the 100-day Exponential Moving Average (EMA) at 0.9117. Therefore, the USD/CHF is trading at 0.9058, below its opening price by 0.34%.
The USD/CHF daily chart is neutral to downward biased but cushioned on the downside by the presence of the 50-day Exponential Moving Average (EMA) at 0.9041, immediately followed by the 20-day EMA at 0.9039. Conversely, USD/CHF’s first resistance is the weekly high, followed by the 100-day EMA and April 10 high at the 0.9117/20 area, tested three times. However, the USD/CHF remains trading below the latter since the end of March 2023.
If USD/CHF would resume its downtrend, it needs a decisive break below the June 9 swing low of 0.8980. Once cleared, the USD/CHF would slide toward June 9, 2021, a low of 0.8925, before testing the 0.8900 figure.
Conversely, for a USD/CHF bullish continuation, the pair must claim the 0.9120 area. Once broken, the USD/CHF next supply zone would be the April 3 high at 0.9196 before challenging the 0.9200 handle.
Technical Levels: Supports and Resistances
USDCHF currently trading at 0.9058 at the time of writing. Pair opened at 0.909 and is trading with a change of -0.35 % .
| Overview | Overview.1 | |
|---|---|---|
| 0 | Today last price | 0.9058 |
| 1 | Today Daily Change | -0.0032 |
| 2 | Today Daily Change % | -0.3500 |
| 3 | Today daily open | 0.9090 |
The pair is trading above its 20 Daily moving average @ 0.9043, above its 50 Daily moving average @ 0.8989 , below its 100 Daily moving average @ 0.9118 and below its 200 Daily moving average @ 0.9354
| Trends | Trends.1 | |
|---|---|---|
| 0 | Daily SMA20 | 0.9043 |
| 1 | Daily SMA50 | 0.8989 |
| 2 | Daily SMA100 | 0.9118 |
| 3 | Daily SMA200 | 0.9354 |
The previous day high was 0.9109 while the previous day low was 0.9016. The daily 38.2% Fib levels comes at 0.9074, expected to provide resistance. Similarly, the daily 61.8% fib level is at 0.9051, expected to provide support.
Note the levels of interest below:
- Pivot support is noted at 0.9034, 0.8978, 0.8941
- Pivot resistance is noted at 0.9128, 0.9165, 0.9221
| Levels | Levels.1 |
|---|---|
| Previous Daily High | 0.9109 |
| Previous Daily Low | 0.9016 |
| Previous Weekly High | 0.9120 |
| Previous Weekly Low | 0.8984 |
| Previous Monthly High | 0.9148 |
| Previous Monthly Low | 0.8820 |
| Daily Fibonacci 38.2% | 0.9074 |
| Daily Fibonacci 61.8% | 0.9051 |
| Daily Pivot Point S1 | 0.9034 |
| Daily Pivot Point S2 | 0.8978 |
| Daily Pivot Point S3 | 0.8941 |
| Daily Pivot Point R1 | 0.9128 |
| Daily Pivot Point R2 | 0.9165 |
| Daily Pivot Point R3 | 0.9221 |
[/s2If]
Nehcap Expert Advisor
The NEHCAP MT4 EA is high quality professional trading system geared to generate returns without using GRID or martingales. Each trade has strict risk per trade parameter. The pairs under management include EURUSD, GBPUSD, AUDCAD, AUDNZD,GBPAUD, EURAUD, EURCAD, CHFJPY and many more.
The system is trading live: LIVE ACCOUNT TRACKING
You can run it free. Apply for a free trial and track our account. Buy the system or use profit share mechanism to generate returns on your MT4.
Join Our Telegram Group
")


