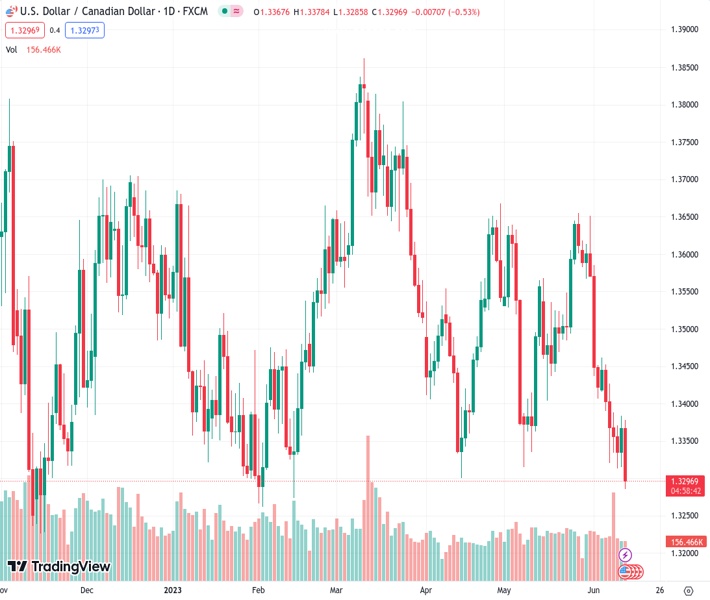
The currency pair USDCAD is currently being traded at 1.33014, which is the lowest it has been since mid-February and it is now below 1.3300.
…
This is a premium post.
[s2If !current_user_can(access_s2member_level4)]Please register for FREE REGISTER to read full post below containing analysis. In case of any error or you think you are not able to read the full post below, please email us at support#nehcap.com [lwa][/s2If] [s2If current_user_can(access_s2member_level1)]
- USD/CAD trades at the lowest level since mid-February, under 1.3300.
The pair currently trades last at 1.33014.
The previous day high was 1.3384 while the previous day low was 1.3315. The daily 38.2% Fib levels comes at 1.3357, expected to provide resistance. Similarly, the daily 61.8% fib level is at 1.3341, expected to provide resistance.
The USD/CAD turned south on Tuesday, falling below 1.3300 as the US Dollar weakened following the release of local inflation data. With data coming below expectations, markets are now fully pricing in a no-hike by the Federal Reserve (Fed) on Wednesday. On the Canadian side, no relevant economic data will be released on Tuesday. The Loonie is also benefiting from higher Oil prices and positive risk sentiment.
The US Bureau of Labor Statistics’ Consumer Price Index (CPI) came below expectations in May. The headline inflation rate slightly decreased to 4% YoY versus the 4.1% expected and down from its previous figure of 4.9%. On the other hand, the Core inflation measure matched expectations easing to 5.3% YoY from the previous 5.5%. On a monthly basis, the CPI and the Core CPI rose 0.1% and 0.4%, respectively.
Following the data, the CME FedWatch Tool suggests that investors have practically fully priced in a no-hike for Wednesday’s Fed decision. Attention now shifts to the following meetings, so that investors will eye any clues regarding forward guidance in Chair Powell’s press conference, the updated macroeconomic forecasts and the dot plots from the Federal Open Market Committee (FOMC). As for now, the stronger case for July’s meeting is a 25 bps hike, whose odds slightly increased to 63%.
The US Dollar, measured by the DXY index, is trading 0.35% lower on the day following inflation numbers, retreating to the 103.30 area.
Based on the daily chart, the USD/CAD shows a bearish bias in the short term, as the Relative Strength Index (RSI) and Moving Average Convergence Divergence (MACD) suggest that the sellers are in control, while the pair trades below its main moving averages.
Upcoming resistance for USD/CAD is seen at the zone at 1.3350 level, followed by the 1.3380 area and the psychological mark at 1.3400. On the other hand, support levels are seen at the 1.3300 area, followed by April’s low at 1.3273 and the 1.3250 zone.
Technical Levels: Supports and Resistances
USDCAD currently trading at 1.3305 at the time of writing. Pair opened at 1.3368 and is trading with a change of -0.47 % .
| Overview | Overview.1 | |
|---|---|---|
| 0 | Today last price | 1.3305 |
| 1 | Today Daily Change | -0.0063 |
| 2 | Today Daily Change % | -0.4700 |
| 3 | Today daily open | 1.3368 |
The pair remains strongly bearish on the daily time frame. It trades below the 20 SMA @ 1.3487, 50 SMA 1.3486, 100 SMA @ 1.3515 and 200 SMA @ 1.3515.
| Trends | Trends.1 | |
|---|---|---|
| 0 | Daily SMA20 | 1.3487 |
| 1 | Daily SMA50 | 1.3486 |
| 2 | Daily SMA100 | 1.3515 |
| 3 | Daily SMA200 | 1.3515 |
The previous day high was 1.3384 while the previous day low was 1.3315. The daily 38.2% Fib levels comes at 1.3357, expected to provide resistance. Similarly, the daily 61.8% fib level is at 1.3341, expected to provide resistance.
Note the levels of interest below:
- Pivot support is noted at 1.3327, 1.3287, 1.3259
- Pivot resistance is noted at 1.3396, 1.3424, 1.3465
| Levels | Levels.1 |
|---|---|
| Previous Daily High | 1.3384 |
| Previous Daily Low | 1.3315 |
| Previous Weekly High | 1.3462 |
| Previous Weekly Low | 1.3313 |
| Previous Monthly High | 1.3655 |
| Previous Monthly Low | 1.3315 |
| Daily Fibonacci 38.2% | 1.3357 |
| Daily Fibonacci 61.8% | 1.3341 |
| Daily Pivot Point S1 | 1.3327 |
| Daily Pivot Point S2 | 1.3287 |
| Daily Pivot Point S3 | 1.3259 |
| Daily Pivot Point R1 | 1.3396 |
| Daily Pivot Point R2 | 1.3424 |
| Daily Pivot Point R3 | 1.3465 |
[/s2If]
Nehcap Expert Advisor
The NEHCAP MT4 EA is high quality professional trading system geared to generate returns without using GRID or martingales. Each trade has strict risk per trade parameter. The pairs under management include EURUSD, GBPUSD, AUDCAD, AUDNZD,GBPAUD, EURAUD, EURCAD, CHFJPY and many more.
The system is trading live: LIVE ACCOUNT TRACKING
You can run it free. Apply for a free trial and track our account. Buy the system or use profit share mechanism to generate returns on your MT4.
Join Our Telegram Group
")


