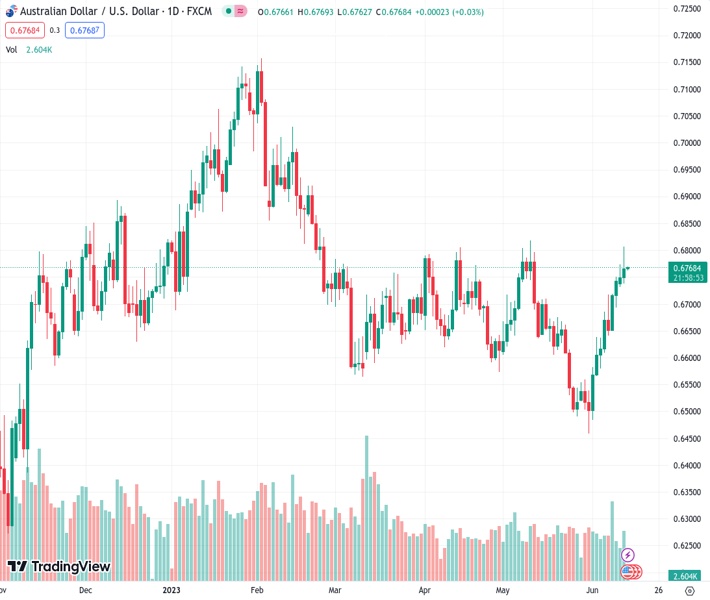
The AUD/USD currency pair fluctuates near its peak level of the past five weeks and tests a four-day upward trend.
…
This is a premium post.
[s2If !current_user_can(access_s2member_level4)]Please register for FREE REGISTER to read full post below containing analysis. In case of any error or you think you are not able to read the full post below, please email us at support#nehcap.com [lwa][/s2If] [s2If current_user_can(access_s2member_level1)]
- AUD/USD seesaws around the highest level in five weeks, prods four-day uptrend.
The pair currently trades last at 0.67672.
The previous day high was 0.6774 while the previous day low was 0.6732. The daily 38.2% Fib levels comes at 0.6757, expected to provide support. Similarly, the daily 61.8% fib level is at 0.6748, expected to provide support.
AUD/USD portrays the typical pre-Fed anxiety as it dribbles around 0.6770 amid the early hours of Wednesday, after refreshing the monthly high the previous day. That said, the Aussie pair cheered downbeat prints of the US inflation data, as well as the firmer sentiment the previous day, to refresh the five-week high before retreating from 0.6806. However, the market’s expectations that the Fed hawks won’t easily leave the table challenge the Aussie pair buyers of late.
The latest US inflation data came in mixed for May and weighed on the US Dollar, following the initial corrective bounce. That said, the headline Consumer Price Index (CPI) drops more-than-expected and prior releases to 0.1% MoM and 4.0% YoY. However, the Core CPI, known as the CPI ex Food & Energy, matches 0.4% monthly and 5.3% yearly forecasts. It’s worth noting that the US headline CPI dropped to the lowest since March 2021 and hence justifies the market’s expectations of the US Federal Reserve (Fed) hawkish halt, which in turn should have weighed on the US Dollar and allow the AUD/USD to grind higher.
That said, the CME’s FedWatch Tool suggests more than 70% chance of the US Federal Reserve’s (Fed) no rate hike during today’s monetary policy meeting. With this, the US Dollar Index (DXY) dropped to the lowest levels in three weeks, taking the Gold Price down with it, before bouncing off 103.05.
Apart from the US inflation and Fed concerns, the People’s Bank of China’s (PBoC) rate cut also allowed the AUD/USD buyers to remain happy, due to the Aussie-China ties. In doing so, the pair traders ignored mixed data at home, as well as fears that the Reserve Bank of Australia (RBA) has limited scope to fuel the rates further towards the north.
While portraying the mood, Wall Street cheered downbeat US inflation and hopes of no rate hike from the Fed but the US Treasury bond yields remain firmer. That said, the US 10-year Treasury bond yields rose to a 13-day high of 3.83% whereas the two-year counterpart poked the highest levels in three months with 4.70% mark before easing to 4.67% in the last hours.
Looking ahead, the recently firmer yields join the downbeat US inflation to prod the AUD/USD bulls. Hence, even if the Fed’s status quo is almost given, the pair traders will pay attention to the US central bank’s economic forecasts, dot-plot and Chairman Jerome Powell’s press conference for clear directions.
Despite the latest retreat, the AUD/USD pair remains well beyond the 200-day Exponential Moving Average (EMA) and the previous resistance line from mid-February, respectively near 0.6755 and 0.6730, which in turn keeps the buyers hopeful.
Technical Levels: Supports and Resistances
AUDUSD currently trading at 0.6765 at the time of writing. Pair opened at 0.675 and is trading with a change of 0.22% % .
| Overview | Overview.1 | |
|---|---|---|
| 0 | Today last price | 0.6765 |
| 1 | Today Daily Change | 0.0015 |
| 2 | Today Daily Change % | 0.22% |
| 3 | Today daily open | 0.675 |
The pair remains strongly bullish on the daily timeframe. It trades above its 20 SMA @ 0.6615, 50 SMA 0.6662, 100 SMA @ 0.6738 and 200 SMA @ 0.6691.
| Trends | Trends.1 | |
|---|---|---|
| 0 | Daily SMA20 | 0.6615 |
| 1 | Daily SMA50 | 0.6662 |
| 2 | Daily SMA100 | 0.6738 |
| 3 | Daily SMA200 | 0.6691 |
The previous day high was 0.6774 while the previous day low was 0.6732. The daily 38.2% Fib levels comes at 0.6757, expected to provide support. Similarly, the daily 61.8% fib level is at 0.6748, expected to provide support.
Note the levels of interest below:
- Pivot support is noted at 0.673, 0.671, 0.6688
- Pivot resistance is noted at 0.6772, 0.6794, 0.6814
| Levels | Levels.1 |
|---|---|
| Previous Daily High | 0.6774 |
| Previous Daily Low | 0.6732 |
| Previous Weekly High | 0.6751 |
| Previous Weekly Low | 0.6579 |
| Previous Monthly High | 0.6818 |
| Previous Monthly Low | 0.6458 |
| Daily Fibonacci 38.2% | 0.6757 |
| Daily Fibonacci 61.8% | 0.6748 |
| Daily Pivot Point S1 | 0.6730 |
| Daily Pivot Point S2 | 0.6710 |
| Daily Pivot Point S3 | 0.6688 |
| Daily Pivot Point R1 | 0.6772 |
| Daily Pivot Point R2 | 0.6794 |
| Daily Pivot Point R3 | 0.6814 |
[/s2If]
Nehcap Expert Advisor
The NEHCAP MT4 EA is high quality professional trading system geared to generate returns without using GRID or martingales. Each trade has strict risk per trade parameter. The pairs under management include EURUSD, GBPUSD, AUDCAD, AUDNZD,GBPAUD, EURAUD, EURCAD, CHFJPY and many more.
The system is trading live: LIVE ACCOUNT TRACKING
You can run it free. Apply for a free trial and track our account. Buy the system or use profit share mechanism to generate returns on your MT4.
Join Our Telegram Group
")


