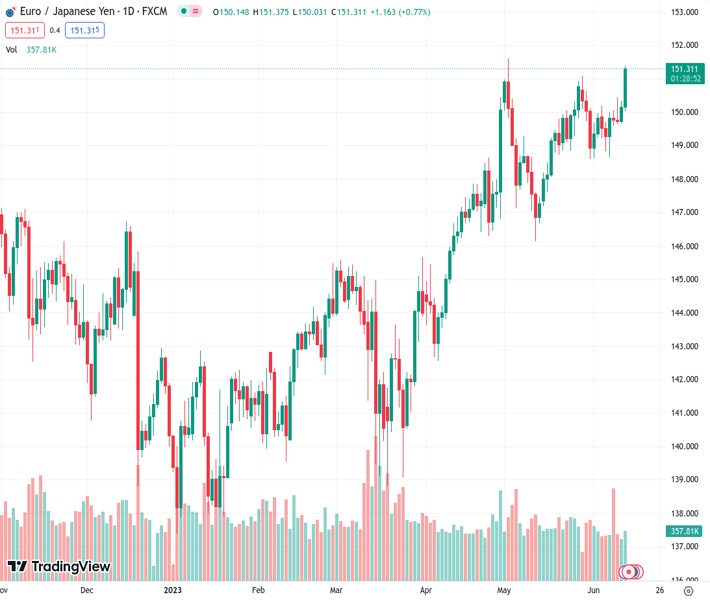
EURJPY rose to its highest level for the month at a value of 151.313 and is now targeting the cycle high of 151.61, which was achieved on May 2.
…
This is a premium post.
[s2If !current_user_can(access_s2member_level4)]Please register for FREE REGISTER to read full post below containing analysis. In case of any error or you think you are not able to read the full post below, please email us at support#nehcap.com [lwa][/s2If] [s2If current_user_can(access_s2member_level1)]
- EUR/JPY jumps to monthly highs and eyes the cycle high at 151.61, struck on May 2.
The pair currently trades last at 151.313.
The previous day high was 150.35 while the previous day low was 149.67. The daily 38.2% Fib levels comes at 150.09, expected to provide support. Similarly, the daily 61.8% fib level is at 149.93, expected to provide support.
The EUR/JPY jumped to its highest level since early May, near 151.20, as the Euro gained traction on rising German bond yields. This means that for Thursday’s European Central Bank (ECB) decision, a 25 basis point (bps) is effectively priced in, and for the Bank of Japan (BoJ), markets expect Governor Ueda to keep its dovish policy settings unchanged. In that sense, monetary policy divergence seems to be weighing on the Yen.
Germany’s final revision from May’s Harmonized Index of Consumer Prices (HICP) remained unchanged at 6.3% YoY, according to the market consensus. Likewise, the Spanish HICP from the same period of time was confirmed at 2.9% and displayed a monthly deceleration. In addition, ZEW surveys for Germany from June came in mixed, with the Economic Sentiment coming in at -8.5 vs the -13.5 expected, while the Current Situation index came in at -56.5 vs the -40 expected
Amid the disinflationary impulse in May and the ongoing weakness seen in the Eurozone (EZ), the burden of proof for the ECB has reversed, implying that the ECB will need to justify why they will need to continue to hike, if they hike at the June 15th meeting. Focus now shifts to the updated forecast of the Bank, and investors will look for clues regarding forward guidance.
That being said, following the data from Germany, bond yields are in decline, and the DAX has risen. The 10-year bond yield increased 4% to 2.46%, while the 2-year yield sits at 3.03% and the 5-year yield 2.48%, with a 0.14% decline, respectively. On the other hand, the German DAX (DAX) stock index trades with 0.83% gains.
According to the daily chart, the EUR/JPY holds a bullish outlook for the short term as the Relative Strength Index (RSI) and Moving Average Convergence Divergence (MACD) both remain in positive territory while the pair stands above its main moving averages, suggesting that the buyers have the upper hand. In addition, there is no strong resistance until the cycle high at 151.61, last seen on May 2, and technicals hint at a retest.
On the upside, If EUR/JPY manages to move higher, the next resistances to watch are at the 151.30 zone, followed by the mentioned cycle high and the psychological mark at 152.00. On the other hand, in case the cross loses more ground, support levels line up at the psychological mark at 150.00 and below around the 20-day Simple Moving Average (SMA) at 149.70 and the 149.00 area.
Technical Levels: Supports and Resistances
EURJPY currently trading at 151.3 at the time of writing. Pair opened at 150.15 and is trading with a change of 0.77 % .
| Overview | Overview.1 | |
|---|---|---|
| 0 | Today last price | 151.30 |
| 1 | Today Daily Change | 1.15 |
| 2 | Today Daily Change % | 0.77 |
| 3 | Today daily open | 150.15 |
The pair remains strongly bullish on the daily timeframe. It trades above its 20 SMA @ 149.65, 50 SMA 148.18, 100 SMA @ 145.44 and 200 SMA @ 144.3.
| Trends | Trends.1 | |
|---|---|---|
| 0 | Daily SMA20 | 149.65 |
| 1 | Daily SMA50 | 148.18 |
| 2 | Daily SMA100 | 145.44 |
| 3 | Daily SMA200 | 144.30 |
The previous day high was 150.35 while the previous day low was 149.67. The daily 38.2% Fib levels comes at 150.09, expected to provide support. Similarly, the daily 61.8% fib level is at 149.93, expected to provide support.
Note the levels of interest below:
- Pivot support is noted at 149.76, 149.38, 149.08
- Pivot resistance is noted at 150.45, 150.74, 151.13
| Levels | Levels.1 |
|---|---|
| Previous Daily High | 150.35 |
| Previous Daily Low | 149.67 |
| Previous Weekly High | 150.44 |
| Previous Weekly Low | 148.63 |
| Previous Monthly High | 151.62 |
| Previous Monthly Low | 146.14 |
| Daily Fibonacci 38.2% | 150.09 |
| Daily Fibonacci 61.8% | 149.93 |
| Daily Pivot Point S1 | 149.76 |
| Daily Pivot Point S2 | 149.38 |
| Daily Pivot Point S3 | 149.08 |
| Daily Pivot Point R1 | 150.45 |
| Daily Pivot Point R2 | 150.74 |
| Daily Pivot Point R3 | 151.13 |
[/s2If]
Nehcap Expert Advisor
The NEHCAP MT4 EA is high quality professional trading system geared to generate returns without using GRID or martingales. Each trade has strict risk per trade parameter. The pairs under management include EURUSD, GBPUSD, AUDCAD, AUDNZD,GBPAUD, EURAUD, EURCAD, CHFJPY and many more.
The system is trading live: LIVE ACCOUNT TRACKING
You can run it free. Apply for a free trial and track our account. Buy the system or use profit share mechanism to generate returns on your MT4.
Join Our Telegram Group
")


