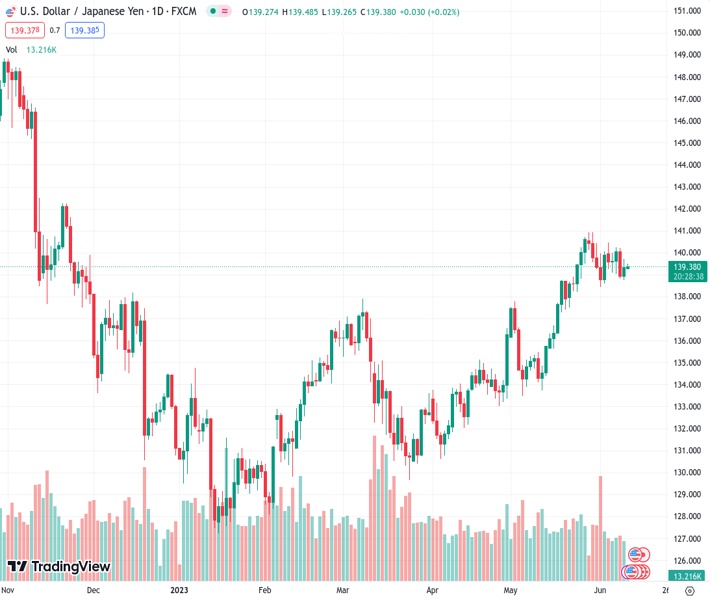
#USDJPY @ 139.381 takes offers to refresh intraday low, pares the previous day’s corrective bounce off weekly bottom. (Pivot Orderbook analysis)
…
This is a premium post.
[s2If !current_user_can(access_s2member_level4)]Please register for FREE REGISTER to read full post below containing analysis. In case of any error or you think you are not able to read the full post below, please email us at support#nehcap.com [lwa][/s2If] [s2If current_user_can(access_s2member_level1)]
- USD/JPY takes offers to refresh intraday low, pares the previous day’s corrective bounce off weekly bottom.
- Japan PPI for May disappoints, BoJ’s Wakatabe rules out monetary policy action at this week’s meeting.
- Yields retreat amid pre-Fed anxiety, US inflation will be the key to confirm no rate hike from FOMC.
- Fed, BoJ inaction may allow Yen pair to continue grinding towards the north.
The pair currently trades last at 139.381.
The previous day high was 139.72 while the previous day low was 138.76. The daily 38.2% Fib levels comes at 139.36, expected to provide support. Similarly, the daily 61.8% fib level is at 139.13, expected to provide support.
USD/JPY consolidates the previous day’s gains with mild losses around 139.30 as Tokyo opens for Monday. In doing so, the Yen pair portrays the market’s cautious mood ahead of the top-tier data/events comprising this week’s monetary policy meeting from the Bank of Japan (BoJ) and the US Federal Reserve (Fed), not to forget the US inflation data.
It’s worth noting that the risk-barometer pair’s latest downbeat performance fails to justify disappointing inflation clues from Japan, as well as dovish comments from the BoJ official.
That said, Japan’s Producer Price Index (PPI) for May dropped for the fifth consecutive month to 5.1% YoY from 5.8% previous readings and 5.5% market forecasts. That said, monthly figures also disappointed Yen traders with -0.7% MoM outcome, versus -0.2% expected and 0.2% prior.
On the other hand, BoJ Deputy Governor Masazumi Wakatabe rules out any change in the BoJ monetary policy during this week’s meeting as he said, “Don’t expect a change from BOJ at this week’s meeting.”
Elsewhere, the the US Dollar Index (DXY) dropped in the last two consecutive weeks, indecisive around 103.56 at the latest, as downbeat prints of the US activity numbers for May joined disappointing employment clues to weigh on the US Dollar. That said, the latest United States Initial Jobless Claims jumped to the highest levels since September 2021 whereas the US ISM Services PMI, S&P Global PMIs and Factory Orders also printed softer outcomes for May and pushed back the Fed hawks, which in turn weighed the US Dollar.
Amid these plays, US Treasury bond yields struggle to extend the previous week’s upward trajectory while S&P500 Futures manage to trace Wall Street’s gains, which in turn should put a floor under the USD/JPY pair due to the quote’s risk-barometer status.
Moving on, a light calendar on Monday may restrict intraday moves of the USD/JPY pair. However, Tuesday’s US inflation will be the key for the Yen pair traders to watch for clear directions. That said, the BoJ and the Fed are both expected to keep the monetary policy unchanged but the odds of the Fed’s hawkish pause are high and hence can recall the USD/JPY bulls in a case where Jerome Powell either surprises markets or defends hawkish bias.
A two-week-old symmetrical triangle restricts immediate USD/JPY moves between 140.00 and 138.85.
Technical Levels: Supports and Resistances
USDJPY currently trading at 139.27 at the time of writing. Pair opened at 139.39 and is trading with a change of -0.09% % .
| Overview | Overview.1 | |
|---|---|---|
| 0 | Today last price | 139.27 |
| 1 | Today Daily Change | -0.12 |
| 2 | Today Daily Change % | -0.09% |
| 3 | Today daily open | 139.39 |
The pair remains strongly bullish on the daily timeframe. It trades above its 20 SMA @ 139.01, 50 SMA 136.05, 100 SMA @ 134.5 and 200 SMA @ 137.3.
| Trends | Trends.1 | |
|---|---|---|
| 0 | Daily SMA20 | 139.01 |
| 1 | Daily SMA50 | 136.05 |
| 2 | Daily SMA100 | 134.50 |
| 3 | Daily SMA200 | 137.30 |
The previous day high was 139.72 while the previous day low was 138.76. The daily 38.2% Fib levels comes at 139.36, expected to provide support. Similarly, the daily 61.8% fib level is at 139.13, expected to provide support.
Note the levels of interest below:
- Pivot support is noted at 138.86, 138.32, 137.89
- Pivot resistance is noted at 139.82, 140.26, 140.79
| Levels | Levels.1 |
|---|---|
| Previous Daily High | 139.72 |
| Previous Daily Low | 138.76 |
| Previous Weekly High | 140.45 |
| Previous Weekly Low | 138.76 |
| Previous Monthly High | 140.93 |
| Previous Monthly Low | 133.50 |
| Daily Fibonacci 38.2% | 139.36 |
| Daily Fibonacci 61.8% | 139.13 |
| Daily Pivot Point S1 | 138.86 |
| Daily Pivot Point S2 | 138.32 |
| Daily Pivot Point S3 | 137.89 |
| Daily Pivot Point R1 | 139.82 |
| Daily Pivot Point R2 | 140.26 |
| Daily Pivot Point R3 | 140.79 |
[/s2If]
Nehcap Expert Advisor
The NEHCAP MT4 EA is high quality professional trading system geared to generate returns without using GRID or martingales. Each trade has strict risk per trade parameter. The pairs under management include EURUSD, GBPUSD, AUDCAD, AUDNZD,GBPAUD, EURAUD, EURCAD, CHFJPY and many more.
The system is trading live: LIVE ACCOUNT TRACKING
You can run it free. Apply for a free trial and track our account. Buy the system or use profit share mechanism to generate returns on your MT4.
Join Our Telegram Group
")


