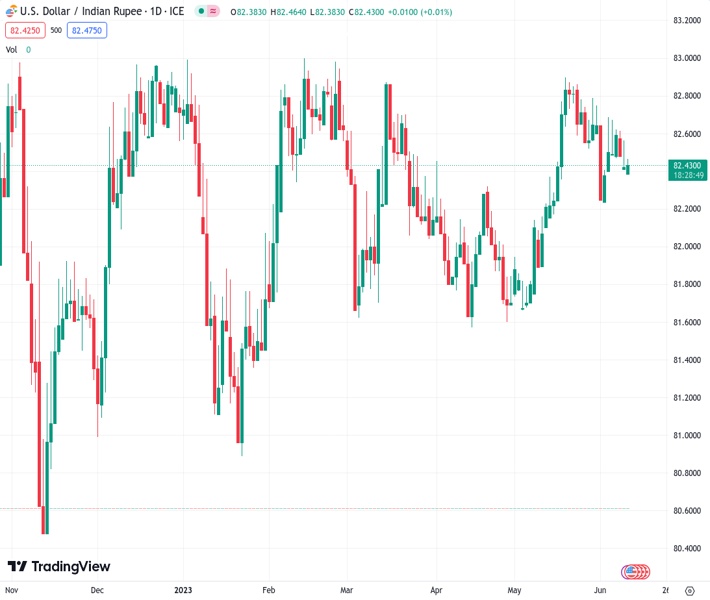
#USDINR @ 82.4380 clings to mild gains after two-day losing streak. (Pivot Orderbook analysis)
…
This is a premium post.
[s2If !current_user_can(access_s2member_level4)]Please register for FREE REGISTER to read full post below containing analysis. In case of any error or you think you are not able to read the full post below, please email us at support#nehcap.com [lwa][/s2If] [s2If current_user_can(access_s2member_level1)]
- USD/INR clings to mild gains after two-day losing streak.
- RBI status quo, hawkish signal fail to impress Indian Rupee buyers much.
- Expectations of no rate hike from Fed in June weigh on prices but US inflation data appears crucial for clear directions.
- India CPI, Output data can entertain USD/INR traders ahead of Tuesday’s key US Core CPI.
The pair currently trades last at 82.4380.
The previous day high was 82.57 while the previous day low was 82.4097. The daily 38.2% Fib levels comes at 82.471, expected to provide resistance. Similarly, the daily 61.8% fib level is at 82.5088, expected to provide resistance.
USD/INR remains depressed while paring the losses marked in the last two consecutive days, mildly bid near 82.45 amid early Monday. In doing so, the Indian Rupee (INR) pair portrays the market’s positioning for the key data from India and the US, as well as the key Federal Reserve (Fed) monetary policy meeting announcements, amid a sluggish start of the crucial week.
That said, downbeat prices of Oil and hawkish comments from the Reserve Bank of India (RBI) joined the broad US Dollar weakness to please the USD/INR bears in the last two days. Also exerting downside pressure on the quote could be the cautious optimism in the Asia-Pacific zone.
During the last week, RBI kept its benchmark rates unchanged, as expected, but showed readiness to further tighten the monetary policy by citing inflation fears. It should be noted that India’s upbeat growth numbers allow the Asian central bank to turn hawkish despite pausing the rate hikes of late.
Elsewhere, WTI crude oil drops 1.45% to $69.30 as it bears the burden of likely more supplies and easing energy demand, due to updates from the Middle East and recession woes respectively. It should be observed that India’s heavy reliance on imported Oil makes INR vulnerable to energy price shifts.
Talking about the risk appetite, markets remain dicey as traders await the top-tier data/events amid mixed feelings. That said, hopes of easy economic recovery in China join expectations of the policy pivot at major central banks keep the USD/INR bears hopeful. While portraying the mood, the US Treasury bond yields grind higher and allow the US Dollar to lick its wounds even as Wall Street and S&P500 Futures prod greenback bulls by printing upbeat outcomes.
Looking forward, India Consumer Price Index (CPI) for May, expected to rise to 5.09% versus 4.7% prior, may recall the USD/INR pair sellers in case of the upbeat data as the RBI has been hawkish in its latest monetary policy announcement, despite keeping rates intact. Also important to watch will be Manufacturing Output, Industrial Output and Cumulative Industrial Output for May.
Above all, Tuesday’s US Core Consumer Price Index (CPI) for May becomes crucial as it will help determine the Fed’s next moves even if markets do expect no rate hike in this week’s Federal Open Market Committee (FOMC) monetary policy decision.
Bearish MACD signals and steady RSI (14) line suggests further downside of the USD/INR pair towards the 50-day Exponential Moving Average (EMA) support of around 82.33. That said, the Indian Rupee (INR) pair’s recovery remains elusive unless crossing a 13-day-old resistance line, close to 82.60 at the latest.
Technical Levels: Supports and Resistances
USDINR currently trading at 82.4648 at the time of writing. Pair opened at 82.4247 and is trading with a change of 0.05% % .
| Overview | Overview.1 | |
|---|---|---|
| 0 | Today last price | 82.4648 |
| 1 | Today Daily Change | 0.0401 |
| 2 | Today Daily Change % | 0.05% |
| 3 | Today daily open | 82.4247 |
The pair is trading below its 20 Daily moving average @ 82.5783, above its 50 Daily moving average @ 82.1929 , above its 100 Daily moving average @ 82.2534 and above its 200 Daily moving average @ 81.9927
| Trends | Trends.1 | |
|---|---|---|
| 0 | Daily SMA20 | 82.5783 |
| 1 | Daily SMA50 | 82.1929 |
| 2 | Daily SMA100 | 82.2534 |
| 3 | Daily SMA200 | 81.9927 |
The previous day high was 82.57 while the previous day low was 82.4097. The daily 38.2% Fib levels comes at 82.471, expected to provide resistance. Similarly, the daily 61.8% fib level is at 82.5088, expected to provide resistance.
Note the levels of interest below:
- Pivot support is noted at 82.3662, 82.3078, 82.2059
- Pivot resistance is noted at 82.5266, 82.6285, 82.6869
| Levels | Levels.1 |
|---|---|
| Previous Daily High | 82.5700 |
| Previous Daily Low | 82.4097 |
| Previous Weekly High | 82.7120 |
| Previous Weekly Low | 82.4030 |
| Previous Monthly High | 82.9810 |
| Previous Monthly Low | 81.6435 |
| Daily Fibonacci 38.2% | 82.4710 |
| Daily Fibonacci 61.8% | 82.5088 |
| Daily Pivot Point S1 | 82.3662 |
| Daily Pivot Point S2 | 82.3078 |
| Daily Pivot Point S3 | 82.2059 |
| Daily Pivot Point R1 | 82.5266 |
| Daily Pivot Point R2 | 82.6285 |
| Daily Pivot Point R3 | 82.6869 |
[/s2If]
Nehcap Expert Advisor
The NEHCAP MT4 EA is high quality professional trading system geared to generate returns without using GRID or martingales. Each trade has strict risk per trade parameter. The pairs under management include EURUSD, GBPUSD, AUDCAD, AUDNZD,GBPAUD, EURAUD, EURCAD, CHFJPY and many more.
The system is trading live: LIVE ACCOUNT TRACKING
You can run it free. Apply for a free trial and track our account. Buy the system or use profit share mechanism to generate returns on your MT4.
Join Our Telegram Group
")


