#EURUSD @ 1.07370 grinds lower within bearish chart formation ahead of US inflation, Fed and ECB announcements., @nehcap view: Further downside expected (Pivot Orderbook analysis)
…
This is a premium post.
[s2If !current_user_can(access_s2member_level4)]Please register for FREE REGISTER to read full post below containing analysis. In case of any error or you think you are not able to read the full post below, please email us at support#nehcap.com [lwa][/s2If] [s2If current_user_can(access_s2member_level1)]
- EUR/USD grinds lower within bearish chart formation ahead of US inflation, Fed and ECB announcements.
- Looming bear cross on MACD, RSI retreat from overbought territory favor sellers.
- 50-SMA adds strength to 1.0720 support; Euro buyers have a bumpy road to travel.
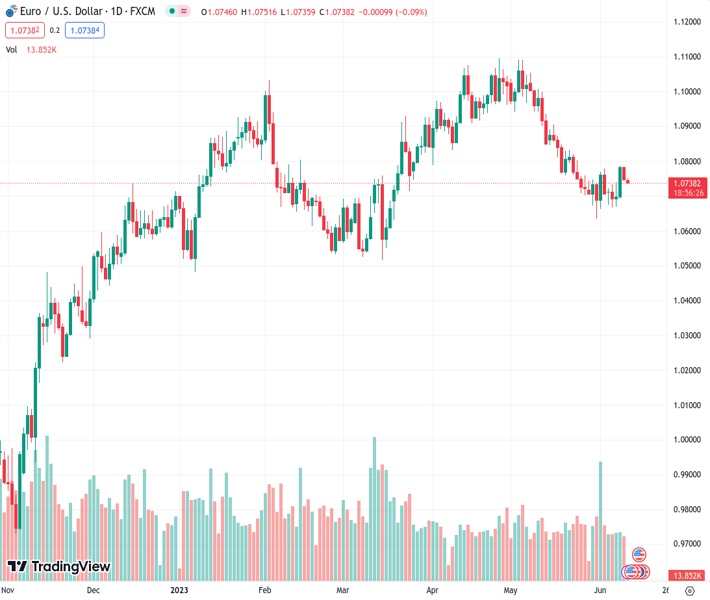
The pair currently trades last at 1.07370.
The previous day high was 1.0785 while the previous day low was 1.0743. The daily 38.2% Fib levels comes at 1.0759, expected to provide resistance. Similarly, the daily 61.8% fib level is at 1.0769, expected to provide resistance.
EUR/USD takes offers to refresh intraday low as it prints mild losses near 1.0745 while extending the previous day’s fall amid early Monday. In doing so, the major currency pair drops with a one-week-old rising wedge bearish chart formation after snapping a four-week downtrend in the last.
Also read: EUR/USD grinds near mid-1.0700s as Fed vs. ECB play gains attention
It’s worth noting that an impending bear cross on the MACD indicator and the RSI (14) line’s U-turn from the overbought territory, towards the 50.0 levels of late, add strength to the Euro pair’s downside bias.
However, a convergence of the 50-SMA and the aforementioned rising wedge’s bottom line, close to 1.0720, appears a tough nut to crack for the EUR/USD bears to crack.
Following that, the previous weekly low of around 1.0670 may act as an intermediate halt before directing the bears toward the yearly low marked in May surrounding 1.0635.
It should be observed that the rising wedge’s confirmation ultimately directs the Euro bears toward the theoretical target of around 1.0570.
Alternatively, EUR/USD recovery needs to defy the rising wedge bearish chart pattern by crossing the 1.0790 hurdle, quickly followed by the 1.0800 psychological resistance, to convince the Euro buyers.
Even so, multiple stops marked in late May around 1.0830 and 1.0845-50 can challenge the Euro pair buyers before giving them control.
Trend: Further downside expected
Technical Levels: Supports and Resistances
EURUSD currently trading at 1.0742 at the time of writing. Pair opened at 1.0749 and is trading with a change of -0.07% % .
| Overview | Overview.1 | |
|---|---|---|
| 0 | Today last price | 1.0742 |
| 1 | Today Daily Change | -0.0007 |
| 2 | Today Daily Change % | -0.07% |
| 3 | Today daily open | 1.0749 |
The pair is trading below its 20 Daily moving average @ 1.0759, below its 50 Daily moving average @ 1.0885 , below its 100 Daily moving average @ 1.0808 and above its 200 Daily moving average @ 1.052
| Trends | Trends.1 | |
|---|---|---|
| 0 | Daily SMA20 | 1.0759 |
| 1 | Daily SMA50 | 1.0885 |
| 2 | Daily SMA100 | 1.0808 |
| 3 | Daily SMA200 | 1.0520 |
The previous day high was 1.0785 while the previous day low was 1.0743. The daily 38.2% Fib levels comes at 1.0759, expected to provide resistance. Similarly, the daily 61.8% fib level is at 1.0769, expected to provide resistance.
Note the levels of interest below:
- Pivot support is noted at 1.0733, 1.0717, 1.069
- Pivot resistance is noted at 1.0775, 1.0801, 1.0817
| Levels | Levels.1 |
|---|---|
| Previous Daily High | 1.0785 |
| Previous Daily Low | 1.0743 |
| Previous Weekly High | 1.0787 |
| Previous Weekly Low | 1.0667 |
| Previous Monthly High | 1.1092 |
| Previous Monthly Low | 1.0635 |
| Daily Fibonacci 38.2% | 1.0759 |
| Daily Fibonacci 61.8% | 1.0769 |
| Daily Pivot Point S1 | 1.0733 |
| Daily Pivot Point S2 | 1.0717 |
| Daily Pivot Point S3 | 1.0690 |
| Daily Pivot Point R1 | 1.0775 |
| Daily Pivot Point R2 | 1.0801 |
| Daily Pivot Point R3 | 1.0817 |
[/s2If]
Nehcap Expert Advisor
The NEHCAP MT4 EA is high quality professional trading system geared to generate returns without using GRID or martingales. Each trade has strict risk per trade parameter. The pairs under management include EURUSD, GBPUSD, AUDCAD, AUDNZD,GBPAUD, EURAUD, EURCAD, CHFJPY and many more.
The system is trading live: LIVE ACCOUNT TRACKING
You can run it free. Apply for a free trial and track our account. Buy the system or use profit share mechanism to generate returns on your MT4.
Join Our Telegram Group
")


