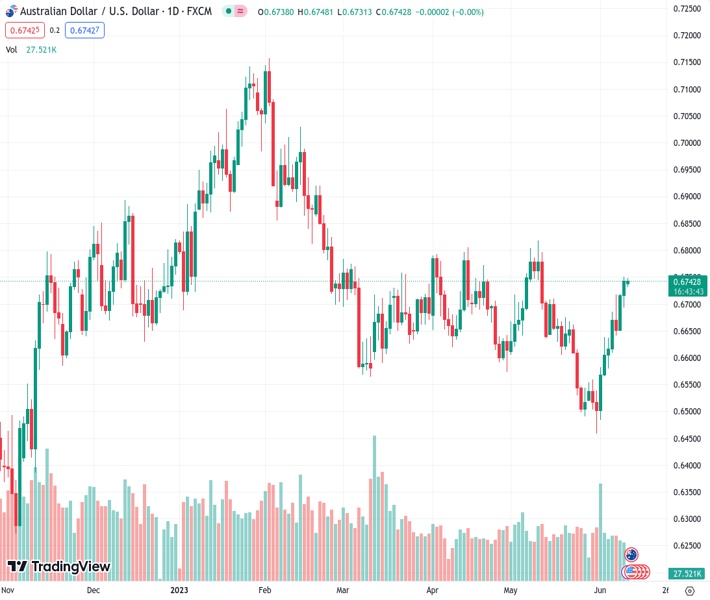
#AUDUSD @ 0.67424 consolidates its recent strong gains to a one-month top touched on Friday. (Pivot Orderbook analysis)
…
This is a premium post.
[s2If !current_user_can(access_s2member_level4)]Please register for FREE REGISTER to read full post below containing analysis. In case of any error or you think you are not able to read the full post below, please email us at support#nehcap.com [lwa][/s2If] [s2If current_user_can(access_s2member_level1)]
- AUD/USD consolidates its recent strong gains to a one-month top touched on Friday.
- Worries about the slowing global economy and modest USD strength cap the major.
- The RBA’s hawkish outlook acts as a tailwind ahead of this week’s data/event risks.
The pair currently trades last at 0.67424.
The previous day high was 0.6751 while the previous day low was 0.6693. The daily 38.2% Fib levels comes at 0.6729, expected to provide support. Similarly, the daily 61.8% fib level is at 0.6715, expected to provide support.
The AUD/USD pair enters a bullish consolidation phase on the first day of a new week and oscillates in a narrow trading band, just below mid-0.6700s or a one-month high touched on Friday. Bulls still await a sustained strength beyond the 100-day Simple Moving Average (SMA) before placing fresh bets and positioning for an extension of the recent upward trajectory witnessed since the beginning of the current month.
The Reserve Bank of Australia’s (RBA) surprise 25 bps rate hike last week and a more hawkish policy statement continue to underpin the Australian Dollar (AUD). In fact, RBA Governor Lowe on Wednesday defended the move to lift the benchmark rates above 4% for the first time in nearly 12 years and reiterated that interest rates may need to rise further in order to curb overheated inflation. This, in turn, acts as a tailwind for the AUD/USD pair, though a combination of factors is holding back bulls from placing aggressive bets and capping the upside, at least for the time being.
Growing worries about a global economic downturn, particularly in China, assists the safe-haven US Dollar (USD) to gain some follow-through positive traction for the second straight day and caps gains for the China-proxy Aussie. Any further USD move up, meanwhile, seems limited in the wake of the uncertainty over the Federal Reserve’s (Fed) next policy move. In fact, the recent dovish rhetoric by Fed officials reaffirmed expectations for an imminent pause in the US central bank’s policy tightening cycle. The markets, however, are still pricing in the possibility of another 25 bps lift-off in July.
Hence, the focus will remain glued to the outcome of the highly-anticipated two-day FOMC monetary policy meeting, scheduled to be announced on Wednesday. Investors will look for fresh clues about the Fed’s near-term policy outlook, which will play a key role in influencing the USD price dynamics and determine the next leg of a directional move for the AUD/USD pair. Heading into the key central bank event risk, the release of the US consumer inflation figures on Tuesday should infuse some volatility in the markets and produce short-term trading opportunities around the major.
Technical Levels: Supports and Resistances
AUDUSD currently trading at 0.6742 at the time of writing. Pair opened at 0.6742 and is trading with a change of 0.0 % .
| Overview | Overview.1 | |
|---|---|---|
| 0 | Today last price | 0.6742 |
| 1 | Today Daily Change | 0.0000 |
| 2 | Today Daily Change % | 0.0000 |
| 3 | Today daily open | 0.6742 |
The pair remains strongly bullish on the daily timeframe. It trades above its 20 SMA @ 0.6613, 50 SMA 0.6663, 100 SMA @ 0.6741 and 200 SMA @ 0.6691.
| Trends | Trends.1 | |
|---|---|---|
| 0 | Daily SMA20 | 0.6613 |
| 1 | Daily SMA50 | 0.6663 |
| 2 | Daily SMA100 | 0.6741 |
| 3 | Daily SMA200 | 0.6691 |
The previous day high was 0.6751 while the previous day low was 0.6693. The daily 38.2% Fib levels comes at 0.6729, expected to provide support. Similarly, the daily 61.8% fib level is at 0.6715, expected to provide support.
Note the levels of interest below:
- Pivot support is noted at 0.6706, 0.6671, 0.6649
- Pivot resistance is noted at 0.6764, 0.6786, 0.6822
| Levels | Levels.1 |
|---|---|
| Previous Daily High | 0.6751 |
| Previous Daily Low | 0.6693 |
| Previous Weekly High | 0.6751 |
| Previous Weekly Low | 0.6579 |
| Previous Monthly High | 0.6818 |
| Previous Monthly Low | 0.6458 |
| Daily Fibonacci 38.2% | 0.6729 |
| Daily Fibonacci 61.8% | 0.6715 |
| Daily Pivot Point S1 | 0.6706 |
| Daily Pivot Point S2 | 0.6671 |
| Daily Pivot Point S3 | 0.6649 |
| Daily Pivot Point R1 | 0.6764 |
| Daily Pivot Point R2 | 0.6786 |
| Daily Pivot Point R3 | 0.6822 |
[/s2If]
Nehcap Expert Advisor
The NEHCAP MT4 EA is high quality professional trading system geared to generate returns without using GRID or martingales. Each trade has strict risk per trade parameter. The pairs under management include EURUSD, GBPUSD, AUDCAD, AUDNZD,GBPAUD, EURAUD, EURCAD, CHFJPY and many more.
The system is trading live: LIVE ACCOUNT TRACKING
You can run it free. Apply for a free trial and track our account. Buy the system or use profit share mechanism to generate returns on your MT4.
Join Our Telegram Group
")


