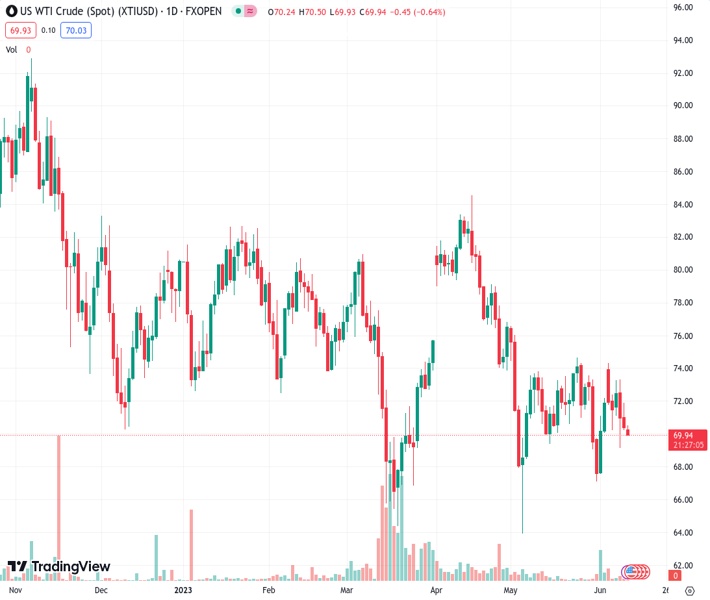
WTI begins trading week with mild losses, down for the third consecutive day. (Pivot Orderbook analysis)
…
This is a premium post.
[s2If !current_user_can(access_s2member_level4)]Please register for FREE REGISTER to read full post below containing analysis. In case of any error or you think you are not able to read the full post below, please email us at support#nehcap.com [lwa][/s2If] [s2If current_user_can(access_s2member_level1)]
- WTI begins trading week with mild losses, down for the third consecutive day.
- Saudi Arabia, Iran flash mixed signals for Oil traders.
- Fears of global economic slowdown jostle with OPEC+ output cut to challenge energy traders.
- Softer US Dollar put a floor under the Oil price, Fed, US inflaion and China data are the key for fresh impulse.
The pair currently trades last at 70.07.
The previous day high was 71.9 while the previous day low was 70.24. The daily 38.2% Fib levels comes at 70.88, expected to provide resistance. Similarly, the daily 61.8% fib level is at 71.27, expected to provide resistance.
WTI crude oil drops to $70.00 as the key week comprising multiple central bank events and the US inflation data begins. In doing so, the black gold fails to justify hawkish signals from Saudi Arabia and hopes of the Federal Reserve’s (Fed) no rate hike, as well as the softer US Dollar, amid expectations of the US-Iran trade deal and fears of economic slowdown.
The latest headlines from Saudi Arabia and Iran have been mixed for the Oil traders who are already struggling with the demand-supply matrix.
“The latest OPEC+ agreement involved comprehensive reform, but that the alliance was also working against ‘uncertainties and sentiment’ within the market,” said Saudi Arabia’s Energy Minister Prince Abdulaziz bin Salman on Sunday, reported Reuters.
On the other hand, Iran’s supreme leader Ayatollah Ali Khamenei said on Sunday, per Reuters, “A deal with the West over Tehran’s nuclear work was possible if the country’s nuclear infrastructure remained intact, amid a stalemate between Tehran and Washington to revive a 2015 nuclear pact.”
It should be noted that speculation about the US-Iran trade deal triggered a slump in the Oil price the previous week before the official sources ruled out the basis and allowed the black gold to lick its wounds.
Elsewhere, fears of slower economic transition on a broader level join the fears of the US-China tension and higher yields to also prod the Oil buyers. On the same line could be the increasing odds of the US Federal Reserve’s (Fed) no rate hike in June, backed by downbeat US data, which in turn weigh on the US Dollar. Furthermore, mixed economics from China and expectations of a slower transition to growth also exert downside pressure on the WTI price.
Moving on, a slew of economics hang to entertain the Oil traders but major attention will be given to Tuesday’s US inflation and Wednesday’s Federal Open Market Committee (FOMC) monetary policy decision for clear directions. Should the US policymakers manage to defend hawks, the black gold may have more reasons to decline.
Oil price grinds within an eight-day-old symmetrical triangle, currently between $69.50 and $73.00. That said, the quote’s sustained trading below the 200-bar Exponential Moving Average (EMA) on the four-hour chart keeps the Oil bears hopeful.
Technical Levels: Supports and Resistances
XTIUSD currently trading at 70.07 at the time of writing. Pair opened at 70.46 and is trading with a change of -0.55% % .
| Overview | Overview.1 | |
|---|---|---|
| 0 | Today last price | 70.07 |
| 1 | Today Daily Change | -0.39 |
| 2 | Today Daily Change % | -0.55% |
| 3 | Today daily open | 70.46 |
The pair remains strongly bearish on the daily time frame. It trades below the 20 SMA @ 71.66, 50 SMA 74.67, 100 SMA @ 75.28 and 200 SMA @ 78.58.
| Trends | Trends.1 | |
|---|---|---|
| 0 | Daily SMA20 | 71.66 |
| 1 | Daily SMA50 | 74.67 |
| 2 | Daily SMA100 | 75.28 |
| 3 | Daily SMA200 | 78.58 |
The previous day high was 71.9 while the previous day low was 70.24. The daily 38.2% Fib levels comes at 70.88, expected to provide resistance. Similarly, the daily 61.8% fib level is at 71.27, expected to provide resistance.
Note the levels of interest below:
- Pivot support is noted at 69.83, 69.2, 68.17
- Pivot resistance is noted at 71.5, 72.53, 73.16
| Levels | Levels.1 |
|---|---|
| Previous Daily High | 71.90 |
| Previous Daily Low | 70.24 |
| Previous Weekly High | 74.36 |
| Previous Weekly Low | 69.17 |
| Previous Monthly High | 76.61 |
| Previous Monthly Low | 64.31 |
| Daily Fibonacci 38.2% | 70.88 |
| Daily Fibonacci 61.8% | 71.27 |
| Daily Pivot Point S1 | 69.83 |
| Daily Pivot Point S2 | 69.20 |
| Daily Pivot Point S3 | 68.17 |
| Daily Pivot Point R1 | 71.50 |
| Daily Pivot Point R2 | 72.53 |
| Daily Pivot Point R3 | 73.16 |
[/s2If]
Nehcap Expert Advisor
The NEHCAP MT4 EA is high quality professional trading system geared to generate returns without using GRID or martingales. Each trade has strict risk per trade parameter. The pairs under management include EURUSD, GBPUSD, AUDCAD, AUDNZD,GBPAUD, EURAUD, EURCAD, CHFJPY and many more.
The system is trading live: LIVE ACCOUNT TRACKING
You can run it free. Apply for a free trial and track our account. Buy the system or use profit share mechanism to generate returns on your MT4.
Join Our Telegram Group
")


