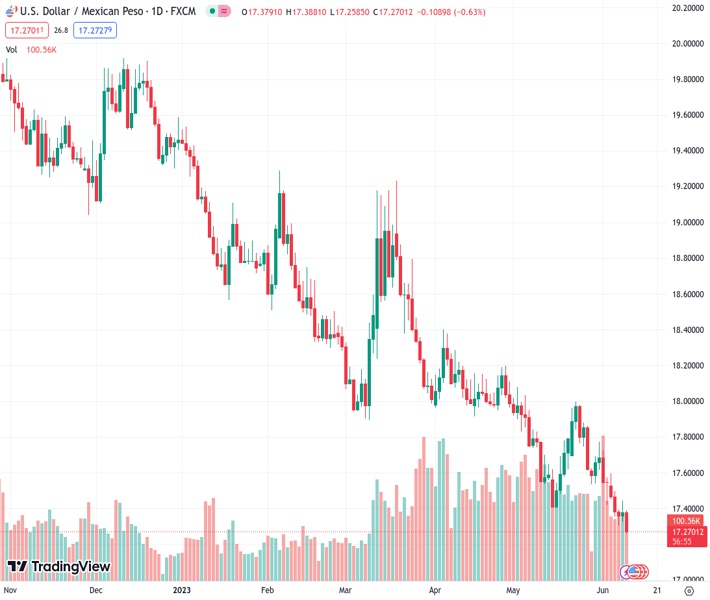
#USDMXN @ 17.2703 falls to seven-year lows, down by 0.63%. (Pivot Orderbook analysis)
…
This is a premium post.
[s2If !current_user_can(access_s2member_level4)]Please register for FREE REGISTER to read full post below containing analysis. In case of any error or you think you are not able to read the full post below, please email us at support#nehcap.com [lwa][/s2If] [s2If current_user_can(access_s2member_level1)]
- USD/MXN falls to seven-year lows, down by 0.63%.
- Mexico’s deflationary process sees May’s CPI falling more than expected, predicted to keep Banxico from raising rates.
- Upbeat market sentiment and expectations for a Fed rate pause ahead of next week’s FOMC meeting weigh the USD.
- Futures market pricing has a 33% chance of a Fed hike next week 90% chance in the July meeting.
The pair currently trades last at 17.2703.
The previous day high was 17.443 while the previous day low was 17.33. The daily 38.2% Fib levels comes at 17.3998, expected to provide resistance. Similarly, the daily 61.8% fib level is at 17.3732, expected to provide resistance.
USD/MXN falls to new seven-year lows as the Mexican Peso (MXN) continues to appreciate sharply against the US Dollar (USD), even though the Mexican central bank is expected to keep rates higher for longer. The USD/MXN is trading at 17.2695, below its opening price.
A risk-on impulse keeps weighing on the greenback ahead of an important week for the US Federal Reserve (Fed), which is set to keep rates unchanged at 5.00%-5.25%. Wall Street is posting solid gains while traders brace for the next week’s FOMC meeting.
Meanwhile, the deflationary process in Mexico is well underway; according to the Instituto Nacional de Estadistica, Geografia e Informatica (INEGI), with the Consumer Price Index (CPI) in May falling -0.22% MoM, well below estimates of -0.16%. Anually based, CPI fell below the prior’s month 6.29%, at 5.84%, beneath the consensus of 5.9%.
That would keep the Bank of Mexico (Banxico) from raising rates, as its Governor Victoria Rodriguez Ceja mentioned, saying the central bank will keep rates unchanged for the next two meetings.
Across the border, an absent economic docket keeps investors leaning on market sentiment, which is upbeat, with the S&P 500 turning bullish after gaining more than 20% from its latest dip. Regarding the Fed’s next monetary policy meeting, money market futures are pricing a 33% chance the Fed will hike next week. Nevertheless, odds are at 90% for the July meeting after two major central banks, which kept rates on pause, scrambled to tighten conditions as inflation resumed upwards.
From a technical perspective, the USD/MXN is poised to test lower levels after breaching July’s 2017 lows of 17.4498. In an article on Thursday, I mentioned that the pair “appears to be bottoming” and that a double bottom could be forming, but price action negated the chart pattern. Therefore, further downside is expected, with 2016 lows at 17.0500 to be tested soon, followed by the 17.00 figure. Conversely, if USD/MXN buyers reclaim, the lows of 2017 at 17.4498 could exacerbate further MXN weakness and lift the pair towards the 20-day EMA at 17.5753.
Technical Levels: Supports and Resistances
USDMXN currently trading at 17.2674 at the time of writing. Pair opened at 17.3795 and is trading with a change of -0.65 % .
| Overview | Overview.1 | |
|---|---|---|
| 0 | Today last price | 17.2674 |
| 1 | Today Daily Change | -0.1121 |
| 2 | Today Daily Change % | -0.6500 |
| 3 | Today daily open | 17.3795 |
The pair remains strongly bearish on the daily time frame. It trades below the 20 SMA @ 17.6219, 50 SMA 17.8474, 100 SMA @ 18.1977 and 200 SMA @ 18.931.
| Trends | Trends.1 | |
|---|---|---|
| 0 | Daily SMA20 | 17.6219 |
| 1 | Daily SMA50 | 17.8474 |
| 2 | Daily SMA100 | 18.1977 |
| 3 | Daily SMA200 | 18.9310 |
The previous day high was 17.443 while the previous day low was 17.33. The daily 38.2% Fib levels comes at 17.3998, expected to provide resistance. Similarly, the daily 61.8% fib level is at 17.3732, expected to provide resistance.
Note the levels of interest below:
- Pivot support is noted at 17.3254, 17.2713, 17.2125
- Pivot resistance is noted at 17.4383, 17.4971, 17.5512
| Levels | Levels.1 |
|---|---|
| Previous Daily High | 17.4430 |
| Previous Daily Low | 17.3300 |
| Previous Weekly High | 17.7716 |
| Previous Weekly Low | 17.4195 |
| Previous Monthly High | 18.0780 |
| Previous Monthly Low | 17.4203 |
| Daily Fibonacci 38.2% | 17.3998 |
| Daily Fibonacci 61.8% | 17.3732 |
| Daily Pivot Point S1 | 17.3254 |
| Daily Pivot Point S2 | 17.2713 |
| Daily Pivot Point S3 | 17.2125 |
| Daily Pivot Point R1 | 17.4383 |
| Daily Pivot Point R2 | 17.4971 |
| Daily Pivot Point R3 | 17.5512 |
[/s2If]
Nehcap Expert Advisor
The NEHCAP MT4 EA is high quality professional trading system geared to generate returns without using GRID or martingales. Each trade has strict risk per trade parameter. The pairs under management include EURUSD, GBPUSD, AUDCAD, AUDNZD,GBPAUD, EURAUD, EURCAD, CHFJPY and many more.
The system is trading live: LIVE ACCOUNT TRACKING
You can run it free. Apply for a free trial and track our account. Buy the system or use profit share mechanism to generate returns on your MT4.
Join Our Telegram Group
")


