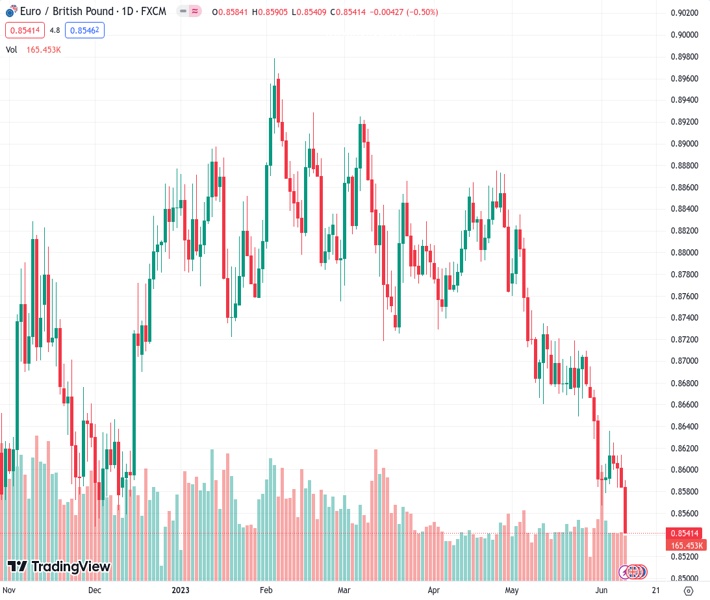
#EURGBP @ 0.85412 falls to a 9-month low as ECB approaches its peak rate and the BoE is ready to continue tightening. (Pivot Orderbook analysis)
…
This is a premium post.
[s2If !current_user_can(access_s2member_level4)]Please register for FREE REGISTER to read full post below containing analysis. In case of any error or you think you are not able to read the full post below, please email us at support#nehcap.com [lwa][/s2If] [s2If current_user_can(access_s2member_level1)]
- EUR/GBP falls to a 9-month low as ECB approaches its peak rate and the BoE is ready to continue tightening.
- The pair signals oversold conditions on the daily chart for the first time since 2021.
- Weak economic data from Italy and Germany contribute to Euro’s decline.
The pair currently trades last at 0.85412.
The previous day high was 0.8614 while the previous day low was 0.8583. The daily 38.2% Fib levels comes at 0.8595, expected to provide resistance. Similarly, the daily 61.8% fib level is at 0.8602, expected to provide resistance.
The EUR/GBP pair has recently witnessed a substantial decline, falling to a nine-month low at 0.8540 and stabilizing around 0.8545. This prolonged downward trend reflects the difficulties faced by the Euro amid the economic downturn in the Eurozone. However, there is some optimism for the British economy as the Bank of England’s projections indicate that the United Kingdom is likely to steer clear of a recession. Furthermore, the fact that inflation in the UK is running high is fueling hawkish bets on the Bank of England (BoE), giving additional support to the Sterling.
The National Institute of Statistics from Italy released that Italian Industrial output decreased by 1.9% in April vs the 0.1% expansion expected from its previous figure which also showed a contraction of -0.6%. On a yearly basis, the output is now down 7.2%. Adding to that, the EZ reported weak final revisions of Q1 Gross Domestic Product (GDP) on Thursday while Germany (the most important economic block from the EZ) goes through a technical recession.
The German yields weakened across the curve on Friday. The 10-year bond yield fell to 2.37% while the 2-year yield sits at 2.96% and the 5-year at 2.42%. In addition, the German DAX stock index closed this week with 0.60 % losses indicating a negative sentiment towards de economic activity in Germany and hence applying selling pressure on the Euro.
For the upcoming European Central Bank (ECB) decision next week, markets are foreseeing a 25 basis point (bps) rate hike announcement and another one in either July or September. For the BoE market participants are anticipating a 100 bps hike to 5.50% for the remained of the tightening cycle.
According to the daily chart, the EUR/GBP holds a bearish outlook for the short term as the Relative Strength Index (RSI) and Moving Average Convergence Divergence (MACD) both suggest that the sellers have control while the pair trades below its main moving averages.
In case the pair faces further downside, support levels line up at the multi-year low at 0.8540 and below around the 0.8535 zone and the 0.8520 level. Conversely, in case the EUR/GBP regains traction, the following resistance lineup at the 0.8560 zone followed by 0.8580 (June 7 low) and the 0.8600 psychological mark.
Technical Levels: Supports and Resistances
EURGBP currently trading at 0.8543 at the time of writing. Pair opened at 0.8584 and is trading with a change of -0.48 % .
| Overview | Overview.1 | |
|---|---|---|
| 0 | Today last price | 0.8543 |
| 1 | Today Daily Change | -0.0041 |
| 2 | Today Daily Change % | -0.4800 |
| 3 | Today daily open | 0.8584 |
The pair remains strongly bearish on the daily time frame. It trades below the 20 SMA @ 0.8655, 50 SMA 0.8735, 100 SMA @ 0.8784 and 200 SMA @ 0.8755.
| Trends | Trends.1 | |
|---|---|---|
| 0 | Daily SMA20 | 0.8655 |
| 1 | Daily SMA50 | 0.8735 |
| 2 | Daily SMA100 | 0.8784 |
| 3 | Daily SMA200 | 0.8755 |
The previous day high was 0.8614 while the previous day low was 0.8583. The daily 38.2% Fib levels comes at 0.8595, expected to provide resistance. Similarly, the daily 61.8% fib level is at 0.8602, expected to provide resistance.
Note the levels of interest below:
- Pivot support is noted at 0.8574, 0.8563, 0.8543
- Pivot resistance is noted at 0.8604, 0.8625, 0.8635
| Levels | Levels.1 |
|---|---|
| Previous Daily High | 0.8614 |
| Previous Daily Low | 0.8583 |
| Previous Weekly High | 0.8695 |
| Previous Weekly Low | 0.8568 |
| Previous Monthly High | 0.8835 |
| Previous Monthly Low | 0.8583 |
| Daily Fibonacci 38.2% | 0.8595 |
| Daily Fibonacci 61.8% | 0.8602 |
| Daily Pivot Point S1 | 0.8574 |
| Daily Pivot Point S2 | 0.8563 |
| Daily Pivot Point S3 | 0.8543 |
| Daily Pivot Point R1 | 0.8604 |
| Daily Pivot Point R2 | 0.8625 |
| Daily Pivot Point R3 | 0.8635 |
[/s2If]
Nehcap Expert Advisor
The NEHCAP MT4 EA is high quality professional trading system geared to generate returns without using GRID or martingales. Each trade has strict risk per trade parameter. The pairs under management include EURUSD, GBPUSD, AUDCAD, AUDNZD,GBPAUD, EURAUD, EURCAD, CHFJPY and many more.
The system is trading live: LIVE ACCOUNT TRACKING
You can run it free. Apply for a free trial and track our account. Buy the system or use profit share mechanism to generate returns on your MT4.
Join Our Telegram Group
")


