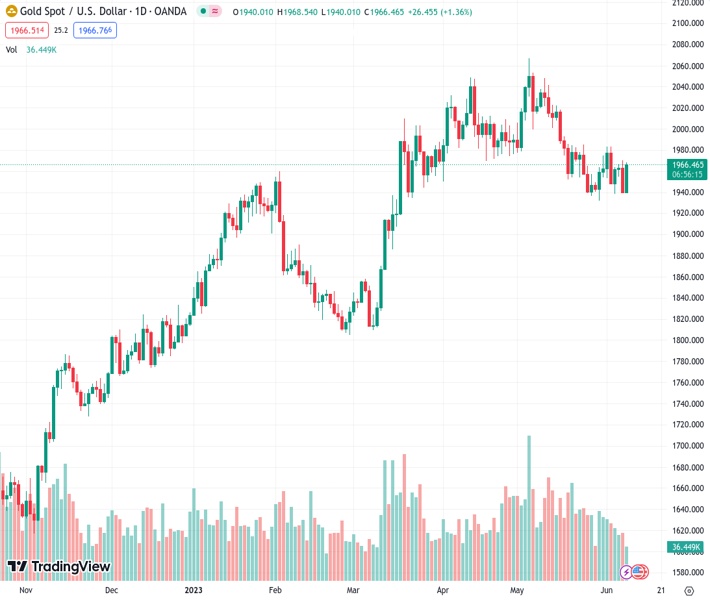
#XAUUSD @ 1966.69 Gold price has galloped to near $1,960.00 as US weekly jobless claims hit a 19-month high. (Pivot Orderbook analysis)
…
This is a premium post.
[s2If !current_user_can(access_s2member_level4)]Please register for FREE REGISTER to read full post below containing analysis. In case of any error or you think you are not able to read the full post below, please email us at support#nehcap.com [lwa][/s2If] [s2If current_user_can(access_s2member_level1)]
- Gold price has galloped to near $1,960.00 as US weekly jobless claims hit a 19-month high.
- The market mood could turn cheerful as higher jobless claims would trim hawkish Fed bets.
- Gold price has managed to defend a breakdown of the Ascending Triangle chart pattern.
The pair currently trades last at 1966.69.
The previous day high was 1970.23 while the previous day low was 1939.9. The daily 38.2% Fib levels comes at 1951.49, expected to provide support. Similarly, the daily 61.8% fib level is at 1958.64, expected to provide support.
Gold price (XAU/USD) has shown a sharp run after the release of higher-than-expected United States weekly jobless claims data. The precious metal has jumped to near $1,960.00 as the US Department of Labor reported a significant jump in the initial claims by 28K to 261K for the week ending June 02 while the street was anticipating a figure of 235K.
S&P500 futures are likely to open on a cautious note, however, the market mood could turn cheerful as higher jobless claims would trim hawkish Federal Reserve (Fed) bets. The US Dollar Index (DXY) has printed a fresh four-day low at 103.60 higher unemployment claims would ease out severe heat in the United States labor market.
19-month high US jobless claims are expected to fetch dovish commentaries from investment banking firms and Fed policymakers. Upbeat labor market conditions were the major catalyst, which was forcing Fed policymakers for supporting more interest rate hikes. The impact of higher jobless claims can also be seen in the US Treasury yields. The yields offered on 10-year US government bonds have sharply dropped below 3.78%.
In the longer-term, easing labor market conditions would also slim resilience in consumer spending and would further ease inflationary pressures.
Gold price has managed to defend a breakdown of the Ascending Triangle chart pattern formed on an hourly scale. The precious metal has rebounded sharply and is approaching the horizontal resistance of the aforementioned pattern is placed from May 19 high at $1,983.29. While the upward-sloping trendline of the chart pattern is plotted from May 30 low at $1,932.12.
Gold price has climbed above the 200-period Exponential Moving Average (EMA) at $1,958.37, which indicates that the long-term trend has turned bullish.
Meanwhile, the Relative Strength Index (RSI) (14) has climbed above 60.00, which indicates that the upside momentum has been triggered.
Technical Levels: Supports and Resistances
XAUUSD currently trading at 1959.57 at the time of writing. Pair opened at 1939.95 and is trading with a change of 1.01 % .
| Overview | Overview.1 | |
|---|---|---|
| 0 | Today last price | 1959.57 |
| 1 | Today Daily Change | 19.62 |
| 2 | Today Daily Change % | 1.01 |
| 3 | Today daily open | 1939.95 |
The pair is trading below its 20 Daily moving average @ 1969.9, below its 50 Daily moving average @ 1990.55 , above its 100 Daily moving average @ 1940.31 and above its 200 Daily moving average @ 1839.01
| Trends | Trends.1 | |
|---|---|---|
| 0 | Daily SMA20 | 1969.90 |
| 1 | Daily SMA50 | 1990.55 |
| 2 | Daily SMA100 | 1940.31 |
| 3 | Daily SMA200 | 1839.01 |
The previous day high was 1970.23 while the previous day low was 1939.9. The daily 38.2% Fib levels comes at 1951.49, expected to provide support. Similarly, the daily 61.8% fib level is at 1958.64, expected to provide support.
Note the levels of interest below:
- Pivot support is noted at 1929.82, 1919.7, 1899.49
- Pivot resistance is noted at 1960.15, 1980.36, 1990.48
| Levels | Levels.1 |
|---|---|
| Previous Daily High | 1970.23 |
| Previous Daily Low | 1939.90 |
| Previous Weekly High | 1983.50 |
| Previous Weekly Low | 1932.12 |
| Previous Monthly High | 2079.76 |
| Previous Monthly Low | 1932.12 |
| Daily Fibonacci 38.2% | 1951.49 |
| Daily Fibonacci 61.8% | 1958.64 |
| Daily Pivot Point S1 | 1929.82 |
| Daily Pivot Point S2 | 1919.70 |
| Daily Pivot Point S3 | 1899.49 |
| Daily Pivot Point R1 | 1960.15 |
| Daily Pivot Point R2 | 1980.36 |
| Daily Pivot Point R3 | 1990.48 |
[/s2If]
Nehcap Expert Advisor
The NEHCAP MT4 EA is high quality professional trading system geared to generate returns without using GRID or martingales. Each trade has strict risk per trade parameter. The pairs under management include EURUSD, GBPUSD, AUDCAD, AUDNZD,GBPAUD, EURAUD, EURCAD, CHFJPY and many more.
The system is trading live: LIVE ACCOUNT TRACKING
You can run it free. Apply for a free trial and track our account. Buy the system or use profit share mechanism to generate returns on your MT4.
Join Our Telegram Group
")


