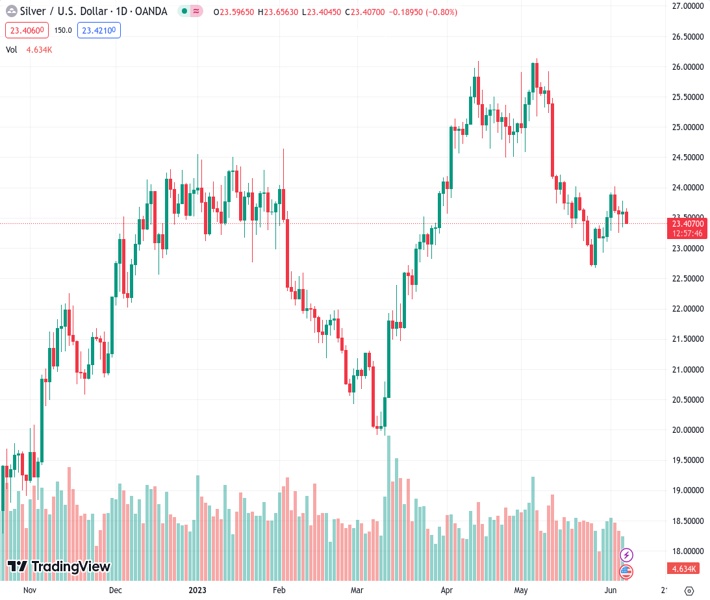
#XAGUSD @ 23.418 Silver meets with some supply on Wednesday and challenges the 200-hour SMA. (Pivot Orderbook analysis)
…
This is a premium post.
[s2If !current_user_can(access_s2member_level4)]Please register for FREE REGISTER to read full post below containing analysis. In case of any error or you think you are not able to read the full post below, please email us at support#nehcap.com [lwa][/s2If] [s2If current_user_can(access_s2member_level1)]
- Silver meets with some supply on Wednesday and challenges the 200-hour SMA.
- The technical setup gradually seems to be shifting in favour of bearish traders.
- A sustained strength beyond $24.00 is needed to negate the negative outlook.
The pair currently trades last at 23.418.
The previous day high was 23.78 while the previous day low was 23.34. The daily 38.2% Fib levels comes at 23.61, expected to provide resistance. Similarly, the daily 61.8% fib level is at 23.51, expected to provide resistance.
Silver comes under some selling pressure on Wednesday and sticks to its modest intraday losses through the early part of the European session. The white metal is currently placed just below the mid-$23.00s, with bears now awaiting a break below the 200-hour Simple Moving Average (SMA) before placing fresh bets and positioning for any further losses.
Against the backdrop of last week’s rejection slide from the $24.00 mark, some follow-through selling will suggest that the recent bounce from a two-month low has run its course and turn the XAG/USD vulnerable amid bearish oscillators on the daily chart. The subsequent downfall has the potential to drag the commodity towards the $23.00 round figure en route to the next relevant support near the $22.70-$22.65 region, or over a two-month low touched in May.
The XAG/USD could eventually drop to the $22.00 mark, which represents a technically significant 200-day SMA, which should act as a strong base and help limit any further losses. That said, a sustained break below will be seen as a fresh trigger for bearish traders and set the stage for the resumption of the recent pullback from over a one-year high, around the $26.15 region, touched in May.
On the flip side, the weekly top, around the $23.75 area set on Tuesday, now seems to act as an immediate barrier ahead of the $24.00 mark. This is closely followed by the $24.15-$24.20 horizontal resistance, which if cleared decisively could trigger a near-term short-covering rally. The XAG/USD might then surpass the $24.45-$24.50 intermediate hurdle and climb to the $24.80 zone before aiming toe reclaim the $25.00 psychological mark.
Technical Levels: Supports and Resistances
XAGUSD currently trading at 23.42 at the time of writing. Pair opened at 23.6 and is trading with a change of -0.76 % .
| Overview | Overview.1 | |
|---|---|---|
| 0 | Today last price | 23.42 |
| 1 | Today Daily Change | -0.18 |
| 2 | Today Daily Change % | -0.76 |
| 3 | Today daily open | 23.60 |
The pair is trading below its 20 Daily moving average @ 23.66, below its 50 Daily moving average @ 24.47 , above its 100 Daily moving average @ 23.34 and above its 200 Daily moving average @ 22.17
| Trends | Trends.1 | |
|---|---|---|
| 0 | Daily SMA20 | 23.66 |
| 1 | Daily SMA50 | 24.47 |
| 2 | Daily SMA100 | 23.34 |
| 3 | Daily SMA200 | 22.17 |
The previous day high was 23.78 while the previous day low was 23.34. The daily 38.2% Fib levels comes at 23.61, expected to provide resistance. Similarly, the daily 61.8% fib level is at 23.51, expected to provide resistance.
Note the levels of interest below:
- Pivot support is noted at 23.36, 23.13, 22.93
- Pivot resistance is noted at 23.8, 24.01, 24.24
| Levels | Levels.1 |
|---|---|
| Previous Daily High | 23.78 |
| Previous Daily Low | 23.34 |
| Previous Weekly High | 24.02 |
| Previous Weekly Low | 22.93 |
| Previous Monthly High | 26.14 |
| Previous Monthly Low | 22.68 |
| Daily Fibonacci 38.2% | 23.61 |
| Daily Fibonacci 61.8% | 23.51 |
| Daily Pivot Point S1 | 23.36 |
| Daily Pivot Point S2 | 23.13 |
| Daily Pivot Point S3 | 22.93 |
| Daily Pivot Point R1 | 23.80 |
| Daily Pivot Point R2 | 24.01 |
| Daily Pivot Point R3 | 24.24 |
[/s2If]
Nehcap Expert Advisor
The NEHCAP MT4 EA is high quality professional trading system geared to generate returns without using GRID or martingales. Each trade has strict risk per trade parameter. The pairs under management include EURUSD, GBPUSD, AUDCAD, AUDNZD,GBPAUD, EURAUD, EURCAD, CHFJPY and many more.
The system is trading live: LIVE ACCOUNT TRACKING
You can run it free. Apply for a free trial and track our account. Buy the system or use profit share mechanism to generate returns on your MT4.
Join Our Telegram Group
")


