WTI remains depressed around intraday low, down for the second consecutive day. (Pivot Orderbook analysis)
…
This is a premium post.
[s2If !current_user_can(access_s2member_level4)]Please register for FREE REGISTER to read full post below containing analysis. In case of any error or you think you are not able to read the full post below, please email us at support#nehcap.com [lwa][/s2If] [s2If current_user_can(access_s2member_level1)]
- WTI remains depressed around intraday low, down for the second consecutive day.
- Sluggish markets, fears of banking crisis underpin US Dollar rebound even as Fed bets weigh on greenback.
- China trade numbers flash mixed signals for May, risk appetite
- API Crude Oil inventories marked surprise draw, EIA stockpiles eyed for clear directions.
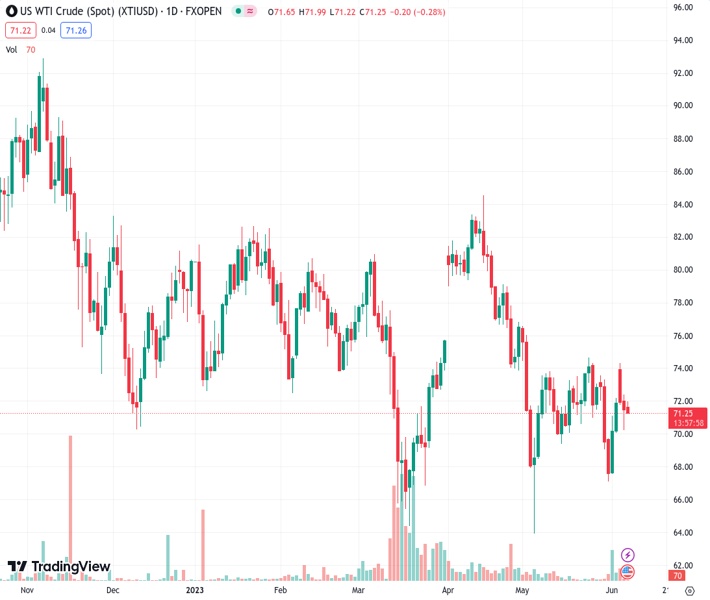
The pair currently trades last at 71.43.
The previous day high was 72.39 while the previous day low was 70.24. The daily 38.2% Fib levels comes at 71.06, expected to provide support. Similarly, the daily 61.8% fib level is at 71.57, expected to provide resistance.
WTI crude oil rebounds from the intraday low of $71.25 heading into Wednesday’s European session. In doing so, the black gold remains bearish for the second consecutive day amid economic fears, as well as the recent recovery in the US Dollar.
Softer statistics from the US, China and Eurozone recently renewed fears of economic slowdown. Additionally, fears of higher rates from the Bank of Japan (BoJ) and hawkish performances of the Reserve Bank of Australia (RBA) and Reserve Bank of New Zealand (RBNZ) also prod the previous economic optimism.
Previously, Saudi Arabia and OPEC+ pledge to deepen oil production cuts joined a surprise draw in the weekly inventories to allow the black gold in grinding higher. That said, the American Petroleum Institute (API) Weekly Crude Oil Stock dropped by 1.71 million barrels in the week ended on June 02 versus the previous addition of 5.20 million barrels.
Furthermore, comments from the US Energy Information Administration (EIA), suggesting that the US crude oil production this year would rise faster and demand increases would cool compared to prior expectations, per Reuters, also weigh on Oil price.
Elsewhere, an absence of the Federal Reserve (Fed) talks and a lack of major data on the calendar joined a recent pick-up in the odds favoring the Fed’s July rate hike to underpin the US Dollar Index (DXY) rebound.
Looking ahead, weekly Oil inventory data from the US Energy Information Administration (EIA) is likely to entertain energy traders. That said, the US Crude Oil Stocks Change is expected to mark a reduction in the inventory build with a 1.5M figure for the week ended on June 02, versus 4.488M previous readings.
Apart from the stockpile data, risk catalysts and economic growth signals will be closely observed for clear directions of the WTI crude oil.
WTI crude oil’s failure to cross the 50-day Exponential Moving Average (EMA), around $73.40, directs the energy bears toward the one-month-old ascending support line, close to $67.85 at the latest.
Technical Levels: Supports and Resistances
XTIUSD currently trading at 71.43 at the time of writing. Pair opened at 71.51 and is trading with a change of -0.11% % .
| Overview | Overview.1 | |
|---|---|---|
| 0 | Today last price | 71.43 |
| 1 | Today Daily Change | -0.08 |
| 2 | Today Daily Change % | -0.11% |
| 3 | Today daily open | 71.51 |
The pair remains strongly bearish on the daily time frame. It trades below the 20 SMA @ 71.67, 50 SMA 74.8, 100 SMA @ 75.56 and 200 SMA @ 78.84.
| Trends | Trends.1 | |
|---|---|---|
| 0 | Daily SMA20 | 71.67 |
| 1 | Daily SMA50 | 74.80 |
| 2 | Daily SMA100 | 75.56 |
| 3 | Daily SMA200 | 78.84 |
The previous day high was 72.39 while the previous day low was 70.24. The daily 38.2% Fib levels comes at 71.06, expected to provide support. Similarly, the daily 61.8% fib level is at 71.57, expected to provide resistance.
Note the levels of interest below:
- Pivot support is noted at 70.37, 69.23, 68.22
- Pivot resistance is noted at 72.52, 73.53, 74.68
| Levels | Levels.1 |
|---|---|
| Previous Daily High | 72.39 |
| Previous Daily Low | 70.24 |
| Previous Weekly High | 73.58 |
| Previous Weekly Low | 67.12 |
| Previous Monthly High | 76.61 |
| Previous Monthly Low | 64.31 |
| Daily Fibonacci 38.2% | 71.06 |
| Daily Fibonacci 61.8% | 71.57 |
| Daily Pivot Point S1 | 70.37 |
| Daily Pivot Point S2 | 69.23 |
| Daily Pivot Point S3 | 68.22 |
| Daily Pivot Point R1 | 72.52 |
| Daily Pivot Point R2 | 73.53 |
| Daily Pivot Point R3 | 74.68 |
[/s2If]
Nehcap Expert Advisor
The NEHCAP MT4 EA is high quality professional trading system geared to generate returns without using GRID or martingales. Each trade has strict risk per trade parameter. The pairs under management include EURUSD, GBPUSD, AUDCAD, AUDNZD,GBPAUD, EURAUD, EURCAD, CHFJPY and many more.
The system is trading live: LIVE ACCOUNT TRACKING
You can run it free. Apply for a free trial and track our account. Buy the system or use profit share mechanism to generate returns on your MT4.
Join Our Telegram Group
")


