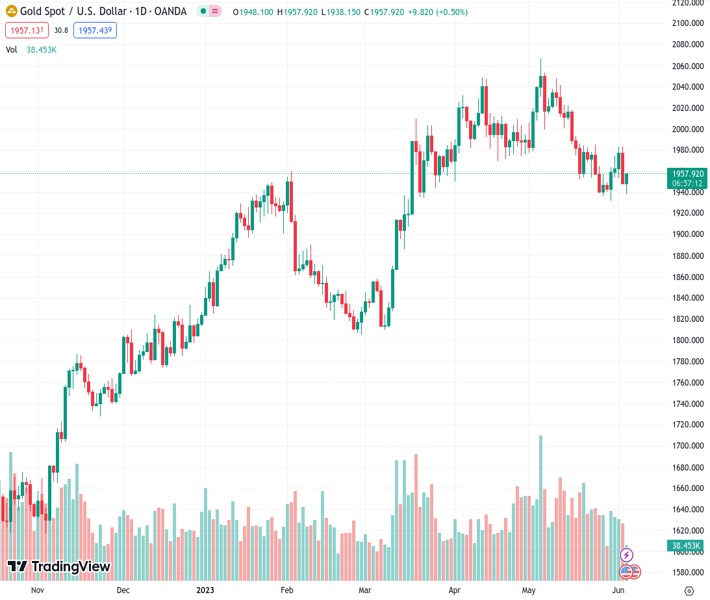
#XAUUSD @ 1,955.44 Gold price is making efforts for recovery from $1,940.00 as the focus shifts to US Services PMI. (Pivot Orderbook analysis)
…
This is a premium post.
[s2If !current_user_can(access_s2member_level4)]Please register for FREE REGISTER to read full post below containing analysis. In case of any error or you think you are not able to read the full post below, please email us at support#nehcap.com [lwa][/s2If] [s2If current_user_can(access_s2member_level1)]
- Gold price is making efforts for recovery from $1,940.00 as the focus shifts to US Services PMI.
- After the release of downbeat Manufacturing PMI, weak service sector performance could propel volatility in the USD Index.
- The yields offered on 10-year US government bonds are holding gains above 3.74%.
The pair currently trades last at 1955.44.
The previous day high was 1983.5 while the previous day low was 1947.56. The daily 38.2% Fib levels comes at 1961.29, expected to provide resistance. Similarly, the daily 61.8% fib level is at 1969.77, expected to provide resistance.
Gold price (XAU/USD) has defended its downside after a fresh four-day low around $1,940.00 in the New York session. The precious metal is expected to deliver a power-pack action as the United States ISM agency is going to release Services PMI numbers for May.
After the release of the downbeat Manufacturing PMI last week, a downbeat performance from the service sector could propel volatility in the US Dollar Index (DXY). US factory activity reported a seventh straight contraction as firms are failing to cater to their fixed and working capital requirements amid higher interest rates by the Federal Reserve (Fed) and tight credit conditions by US regional banks.
According to the preliminary report, US Services PMI is seen declining to 51.5 vs. the prior release of 51.9. New Orders Index that conveys forward demand is seen advancing to 56.5 against the former release of 56.1.
At the press time, the USD Index has faced marginal pressure while attempting to cross the immediate resistance of 104.40. After the release of upbeat US Nonfarm Payrolls data, it is critical to discuss about interest rate policy from Fed. The investing community will get more clarity after getting inflation figures for May ahead.
Meanwhile, S&P500 are expected to open on a mildly bullish note. US equities are expected to continue Friday’s optimism amid consistent macros. The yields offered on 10-year US government bonds are holding gains above 3.74%.
Gold price witnessed an intense sell-off after a mean-reversion move to near the 200-period Exponential Moving Average (EMA) at $1,977.32 on a four-hour scale. The precious metal is declining toward the key support plotted from March 22 low at $1,934.34.
The Relative Strength Index (RSI) (14) is hovering near the 40.00 threshold. Bearish momentum will get triggered on a breakdown into the 20.00-40.00 range.
Technical Levels: Supports and Resistances
XAUUSD currently trading at 1945.13 at the time of writing. Pair opened at 1948.02 and is trading with a change of -0.15 % .
| Overview | Overview.1 | |
|---|---|---|
| 0 | Today last price | 1945.13 |
| 1 | Today Daily Change | -2.89 |
| 2 | Today Daily Change % | -0.15 |
| 3 | Today daily open | 1948.02 |
The pair is trading below its 20 Daily moving average @ 1980.91, below its 50 Daily moving average @ 1991.4 , above its 100 Daily moving average @ 1939.1 and above its 200 Daily moving average @ 1835.68
| Trends | Trends.1 | |
|---|---|---|
| 0 | Daily SMA20 | 1980.91 |
| 1 | Daily SMA50 | 1991.40 |
| 2 | Daily SMA100 | 1939.10 |
| 3 | Daily SMA200 | 1835.68 |
The previous day high was 1983.5 while the previous day low was 1947.56. The daily 38.2% Fib levels comes at 1961.29, expected to provide resistance. Similarly, the daily 61.8% fib level is at 1969.77, expected to provide resistance.
Note the levels of interest below:
- Pivot support is noted at 1935.89, 1923.75, 1899.95
- Pivot resistance is noted at 1971.83, 1995.63, 2007.77
| Levels | Levels.1 |
|---|---|
| Previous Daily High | 1983.50 |
| Previous Daily Low | 1947.56 |
| Previous Weekly High | 1983.50 |
| Previous Weekly Low | 1932.12 |
| Previous Monthly High | 2079.76 |
| Previous Monthly Low | 1932.12 |
| Daily Fibonacci 38.2% | 1961.29 |
| Daily Fibonacci 61.8% | 1969.77 |
| Daily Pivot Point S1 | 1935.89 |
| Daily Pivot Point S2 | 1923.75 |
| Daily Pivot Point S3 | 1899.95 |
| Daily Pivot Point R1 | 1971.83 |
| Daily Pivot Point R2 | 1995.63 |
| Daily Pivot Point R3 | 2007.77 |
[/s2If]
Nehcap Expert Advisor
The NEHCAP MT4 EA is high quality professional trading system geared to generate returns without using GRID or martingales. Each trade has strict risk per trade parameter. The pairs under management include EURUSD, GBPUSD, AUDCAD, AUDNZD,GBPAUD, EURAUD, EURCAD, CHFJPY and many more.
The system is trading live: LIVE ACCOUNT TRACKING
You can run it free. Apply for a free trial and track our account. Buy the system or use profit share mechanism to generate returns on your MT4.
Join Our Telegram Group
")


