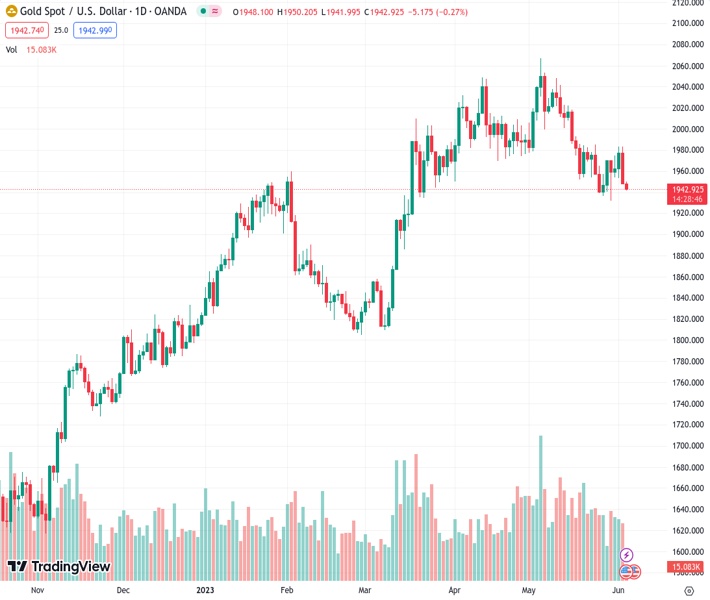
#XAUUSD @ 1,942.75 Gold price has found a short-term cushion near $1,943.00, however, more downside seems favored. (Pivot Orderbook analysis)
…
This is a premium post.
[s2If !current_user_can(access_s2member_level4)]Please register for FREE REGISTER to read full post below containing analysis. In case of any error or you think you are not able to read the full post below, please email us at support#nehcap.com [lwa][/s2If] [s2If current_user_can(access_s2member_level1)]
- Gold price has found a short-term cushion near $1,943.00, however, more downside seems favored.
- The USD Index is expected to climb above 104.00 as the odds of one more interest rate hike by the Fed are extremely solid.
- Gold price witnessed an intense sell-off after a mean-reversion move to near the 200-period EMA at $1,977.32.
The pair currently trades last at 1942.75.
The previous day high was 1983.5 while the previous day low was 1947.56. The daily 38.2% Fib levels comes at 1961.29, expected to provide resistance. Similarly, the daily 61.8% fib level is at 1969.77, expected to provide resistance.
Gold price (XAU/USD) has found an intermediate support of around $1,943.00 in the early European session. The downside in the precious metal has intervened for the short-term, however, more losses are still in the pipeline as the Federal Reserve (Fed) is expected to raise interest rates further to keep pressure on stubborn United States inflation.
S&P500 futures have trimmed some losses generated in Asia, indicating a recovery in the risk appetite of the market participants. US equities remained in the bullish trajectory on Friday despite the release of the better-than-anticipated Nonfarm Payrolls (NFP) data.
The US Dollar Index (DXY) is continuously trading sideways around 104.00 after a stellar rally. It seems that the USD Index is gathering strength for further upside. Higher odds of one more interest rate hike from the Federal Reserve (Fed) have also fueled fresh blood into US Treasury yields. The yields offered on 10-year US Treasury bonds have climbed strongly above 3.74%.
After the seventh straight contraction in US factory activity, investors are shifting their focus towards the release of the US ISM Services PMI data. US Manufacturing PMI has been failing in reclaiming the 50.0 threshold for the past seven months, however, the Services PMI is performing critically better than the manufacturing sector. As per the preliminary report, US Services PMI is seen declining to 51.5 vs. the prior release of 51.9. New Orders Index that displays forward demand is seen advancing to 56.5 against the former release of 56.1.
Gold price witnessed an intense sell-off after a mean-reversion move to near the 200-period Exponential Moving Average (EMA) at $1,977.32 on a four-hour scale. The precious metal is declining toward the key support plotted from March 22 low at $1,934.34.
The Relative Strength Index (RSI) (14) is hovering near the 40.00 edge. A breakdown in the same will be followed by the activation of the bearish momentum.
Technical Levels: Supports and Resistances
XAUUSD currently trading at 1943.37 at the time of writing. Pair opened at 1948.02 and is trading with a change of -0.24 % .
| Overview | Overview.1 | |
|---|---|---|
| 0 | Today last price | 1943.37 |
| 1 | Today Daily Change | -4.65 |
| 2 | Today Daily Change % | -0.24 |
| 3 | Today daily open | 1948.02 |
The pair is trading below its 20 Daily moving average @ 1980.91, below its 50 Daily moving average @ 1991.4 , above its 100 Daily moving average @ 1939.1 and above its 200 Daily moving average @ 1835.68
| Trends | Trends.1 | |
|---|---|---|
| 0 | Daily SMA20 | 1980.91 |
| 1 | Daily SMA50 | 1991.40 |
| 2 | Daily SMA100 | 1939.10 |
| 3 | Daily SMA200 | 1835.68 |
The previous day high was 1983.5 while the previous day low was 1947.56. The daily 38.2% Fib levels comes at 1961.29, expected to provide resistance. Similarly, the daily 61.8% fib level is at 1969.77, expected to provide resistance.
Note the levels of interest below:
- Pivot support is noted at 1935.89, 1923.75, 1899.95
- Pivot resistance is noted at 1971.83, 1995.63, 2007.77
| Levels | Levels.1 |
|---|---|
| Previous Daily High | 1983.50 |
| Previous Daily Low | 1947.56 |
| Previous Weekly High | 1983.50 |
| Previous Weekly Low | 1932.12 |
| Previous Monthly High | 2079.76 |
| Previous Monthly Low | 1932.12 |
| Daily Fibonacci 38.2% | 1961.29 |
| Daily Fibonacci 61.8% | 1969.77 |
| Daily Pivot Point S1 | 1935.89 |
| Daily Pivot Point S2 | 1923.75 |
| Daily Pivot Point S3 | 1899.95 |
| Daily Pivot Point R1 | 1971.83 |
| Daily Pivot Point R2 | 1995.63 |
| Daily Pivot Point R3 | 2007.77 |
[/s2If]
Nehcap Expert Advisor
The NEHCAP MT4 EA is high quality professional trading system geared to generate returns without using GRID or martingales. Each trade has strict risk per trade parameter. The pairs under management include EURUSD, GBPUSD, AUDCAD, AUDNZD,GBPAUD, EURAUD, EURCAD, CHFJPY and many more.
The system is trading live: LIVE ACCOUNT TRACKING
You can run it free. Apply for a free trial and track our account. Buy the system or use profit share mechanism to generate returns on your MT4.
Join Our Telegram Group
")


