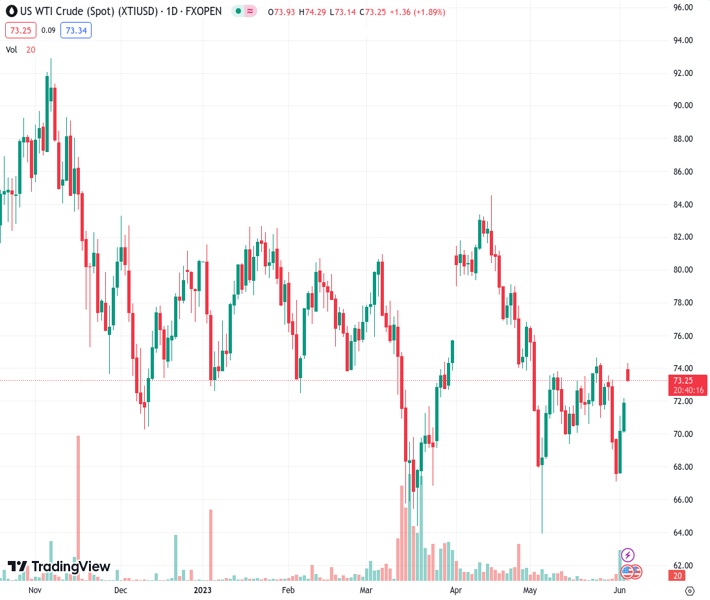
WTI crude oil grinds higher after week-start gap towards the north, prints three-day uptrend. (Pivot Orderbook analysis)
…
This is a premium post.
[s2If !current_user_can(access_s2member_level4)]Please register for FREE REGISTER to read full post below containing analysis. In case of any error or you think you are not able to read the full post below, please email us at support#nehcap.com [lwa][/s2If] [s2If current_user_can(access_s2member_level1)]
- WTI crude oil grinds higher after week-start gap towards the north, prints three-day uptrend.
- OPEC+ extends production cut deal into 2024, Saudi Arabia pledges for more output reduction.
- US-China fears escalate amid no talks in Shangri-la Dialogue, Navy presence in Taiwan Strait.
- Firmer US Dollar, challenges to risk prods Oil buyers ahead of key US, China PMIs.
The pair currently trades last at 73.19.
The previous day high was 72.21 while the previous day low was 70.06. The daily 38.2% Fib levels comes at 71.39, expected to provide support. Similarly, the daily 61.8% fib level is at 70.88, expected to provide support.
WTI crude oil pares intraday gains around $73.20, after the week started with a gap towards the north, as headlines suggesting challenges to the Oil output contrast with the US Dollar’s run-up. Also likely to weigh on the black gold could be the cautious mood ahead of the key China and US data, as well as the risk risk-off mood.
The Organization of the Petroleum Exporting Countries and allies led by Russia, collectively known as OPEC+, agreed on a new output target of 40.46 million barrels per day (mb/d) from 2024 during its June 4 Ministerial meeting.
Not only that, Saudi Arabia’s readiness for more output cuts also allowed the black gold to begin the week on a front foot. In this regard, Saudi Arabia’s Energy Minister, Prince Abdulaziz bin Salman, said on Sunday, “Saudi Arabia to make extra 1 mln b/d output cut from July,” reported Reuters.
On a different page, escalating geopolitical concerns emanating from the Shangri-la Dialogue held in Singapore and the Russia-Ukraine war also allow the WTI crude oil buyers to remain hopeful. The Shangri-la Dialogue in Singapore renewed geopolitical fears surrounding the US and China amid no meeting of the policymakers of both nations, as well as an incident suggesting escalating war fears among the Sino-American navies in the Taiwan Strait. Furthermore, news from Russian Defense Ministry suggesting large-scale military operations by Ukraine added to the Russia-Ukraine war fears and allow the Oil buyers to remain hopeful.
However, the risk-off mood joins the recently firmer US Nonfarm Payrolls (NFP) to underpin the US Dollar strength and prod the WTI bulls of late.
That said, the US Dollar Index (DXY) renews its intraday high around 104.20 while extending the previous day’s recovery from a one-week low. It should be noted that the corrective bounce in the US Treasury bond yields contrasts with the mildly offered S&P500 Futures to also challenge the Oil buyers.
Looking forward, the energy benchmark may witness further consolidation of the gains if today’s China Caixin Services PMI and US ISM Services PMI for May print downbeat figures and challenge the energy demand outlook, especially amid the firmer US Dollar.
Unless providing a daily close beyond the 50-day Exponential Moving Average (EMA), around $73.60 at the latest, the WTI crude oil’s recovery remains doubtful.
Technical Levels: Supports and Resistances
XTIUSD currently trading at 73.19 at the time of writing. Pair opened at 71.91 and is trading with a change of 1.78% % .
| Overview | Overview.1 | |
|---|---|---|
| 0 | Today last price | 73.19 |
| 1 | Today Daily Change | 1.28 |
| 2 | Today Daily Change % | 1.78% |
| 3 | Today daily open | 71.91 |
The pair is trading above its 20 Daily moving average @ 71.8, below its 50 Daily moving average @ 74.78 , below its 100 Daily moving average @ 75.71 and below its 200 Daily moving average @ 79.07
| Trends | Trends.1 | |
|---|---|---|
| 0 | Daily SMA20 | 71.80 |
| 1 | Daily SMA50 | 74.78 |
| 2 | Daily SMA100 | 75.71 |
| 3 | Daily SMA200 | 79.07 |
The previous day high was 72.21 while the previous day low was 70.06. The daily 38.2% Fib levels comes at 71.39, expected to provide support. Similarly, the daily 61.8% fib level is at 70.88, expected to provide support.
Note the levels of interest below:
- Pivot support is noted at 70.58, 69.24, 68.43
- Pivot resistance is noted at 72.73, 73.55, 74.88
| Levels | Levels.1 |
|---|---|
| Previous Daily High | 72.21 |
| Previous Daily Low | 70.06 |
| Previous Weekly High | 73.58 |
| Previous Weekly Low | 67.12 |
| Previous Monthly High | 76.61 |
| Previous Monthly Low | 64.31 |
| Daily Fibonacci 38.2% | 71.39 |
| Daily Fibonacci 61.8% | 70.88 |
| Daily Pivot Point S1 | 70.58 |
| Daily Pivot Point S2 | 69.24 |
| Daily Pivot Point S3 | 68.43 |
| Daily Pivot Point R1 | 72.73 |
| Daily Pivot Point R2 | 73.55 |
| Daily Pivot Point R3 | 74.88 |
[/s2If]
Nehcap Expert Advisor
The NEHCAP MT4 EA is high quality professional trading system geared to generate returns without using GRID or martingales. Each trade has strict risk per trade parameter. The pairs under management include EURUSD, GBPUSD, AUDCAD, AUDNZD,GBPAUD, EURAUD, EURCAD, CHFJPY and many more.
The system is trading live: LIVE ACCOUNT TRACKING
You can run it free. Apply for a free trial and track our account. Buy the system or use profit share mechanism to generate returns on your MT4.
Join Our Telegram Group
")


