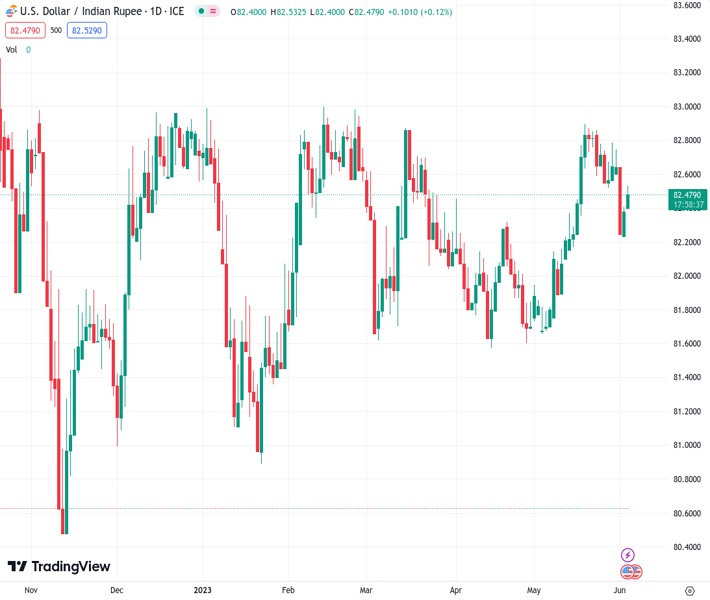
#USDINR @ 82.4975 stays on the front foot after reversing from 13-day low on Friday. (Pivot Orderbook analysis)
…
This is a premium post.
[s2If !current_user_can(access_s2member_level4)]Please register for FREE REGISTER to read full post below containing analysis. In case of any error or you think you are not able to read the full post below, please email us at support#nehcap.com [lwa][/s2If] [s2If current_user_can(access_s2member_level1)]
- USD/INR stays on the front foot after reversing from 13-day low on Friday.
- Strong US NFP renews hawkish Fed concerns while softer India data allows RBI to defend status quo.
- Risk-off mood, higher Oil price also weigh on Indian Rupee ahead of the key week.
- Second-tier US data, risk catalysts may entertain intraday traders.
The pair currently trades last at 82.4975.
The previous day high was 82.453 while the previous day low was 82.2615. The daily 38.2% Fib levels comes at 82.3799, expected to provide support. Similarly, the daily 61.8% fib level is at 82.3347, expected to provide support.
USD/INR extends recovery from 50-day EMA to around 82.50 heading into Monday’s European session. In doing so, the Indian Rupee (INR) pair cheers the US Dollar strength, as well as downbeat sentiment and the firmer Crude Oil price to propel the pair of late.
Adding strength to the USD/INR recovery could be the consolidation ahead of this week’s Reserve Bank of India (RBI) Monetary Policy Meeting, up for Thursday.
Above all, a monetary policy divergence between the Fed and the RBI, mainly due to the latest streams of the US and India data, allow the USD/INR pair to remain firmer. Adding strength to the USD/INR pair could be the latest strength of the WTI Crude Oil and the risk-off mood, led by the fears of the US-China tussle and the Russia-Ukraine war.
That said, Friday’s US NFP bolstered calls for the Fed’s 0.25% rate hike in June, as well as slashed the odds favoring the Fed rate cut in 2023. The same allowed the US Dollar Index (DXY) to remain firmer and favor the corrective bounce in the US Treasury bond yields.
On the other hand, the market’s sour sentiment due to the geopolitical concerns about China, Russia, Ukraine and the US join the concerns about the RBI’s likely monetary policy inaction, mainly due to the Indian economics suggesting easy inflation and softer growth, to propel the USD/INR price.
Against this backdrop, the US 10-year and two-year Treasury bond yields recover after snapping a three-week uptrend by the end of the last Friday. That said, the S&P500 Futures also portray the risk-off mood by mild losses as it retreats from the highest levels since August 2022. The same underpins the US Dollar Index (DXY) strength ahead of the US Factory Orders and ISM Services PMI for May.
Moving on, US Factory Orders and ISM Services PMI for May will entertain intraday traders whereas Thursday’s RBI Interest Rate Decision becomes the key event for the USD/INR pair watchers.
A clear rebound from the 50-day Exponential Moving Average (EMA), around 82.30 by the press time, allows USD/INR bulls to aim for a one-week-old descending resistance line of near 82.65.
Technical Levels: Supports and Resistances
USDINR currently trading at 82.526 at the time of writing. Pair opened at 82.4034 and is trading with a change of 0.15% % .
| Overview | Overview.1 | |
|---|---|---|
| 0 | Today last price | 82.526 |
| 1 | Today Daily Change | 0.1226 |
| 2 | Today Daily Change % | 0.15% |
| 3 | Today daily open | 82.4034 |
The pair remains strongly bullish on the daily timeframe. It trades above its 20 SMA @ 82.4584, 50 SMA 82.1602, 100 SMA @ 82.1956 and 200 SMA @ 81.9231.
| Trends | Trends.1 | |
|---|---|---|
| 0 | Daily SMA20 | 82.4584 |
| 1 | Daily SMA50 | 82.1602 |
| 2 | Daily SMA100 | 82.1956 |
| 3 | Daily SMA200 | 81.9231 |
The previous day high was 82.453 while the previous day low was 82.2615. The daily 38.2% Fib levels comes at 82.3799, expected to provide support. Similarly, the daily 61.8% fib level is at 82.3347, expected to provide support.
Note the levels of interest below:
- Pivot support is noted at 82.2922, 82.1811, 82.1007
- Pivot resistance is noted at 82.4838, 82.5642, 82.6753
| Levels | Levels.1 |
|---|---|
| Previous Daily High | 82.4530 |
| Previous Daily Low | 82.2615 |
| Previous Weekly High | 82.8046 |
| Previous Weekly Low | 82.2615 |
| Previous Monthly High | 82.9810 |
| Previous Monthly Low | 81.6435 |
| Daily Fibonacci 38.2% | 82.3799 |
| Daily Fibonacci 61.8% | 82.3347 |
| Daily Pivot Point S1 | 82.2922 |
| Daily Pivot Point S2 | 82.1811 |
| Daily Pivot Point S3 | 82.1007 |
| Daily Pivot Point R1 | 82.4838 |
| Daily Pivot Point R2 | 82.5642 |
| Daily Pivot Point R3 | 82.6753 |
[/s2If]
Nehcap Expert Advisor
The NEHCAP MT4 EA is high quality professional trading system geared to generate returns without using GRID or martingales. Each trade has strict risk per trade parameter. The pairs under management include EURUSD, GBPUSD, AUDCAD, AUDNZD,GBPAUD, EURAUD, EURCAD, CHFJPY and many more.
The system is trading live: LIVE ACCOUNT TRACKING
You can run it free. Apply for a free trial and track our account. Buy the system or use profit share mechanism to generate returns on your MT4.
Join Our Telegram Group
")


