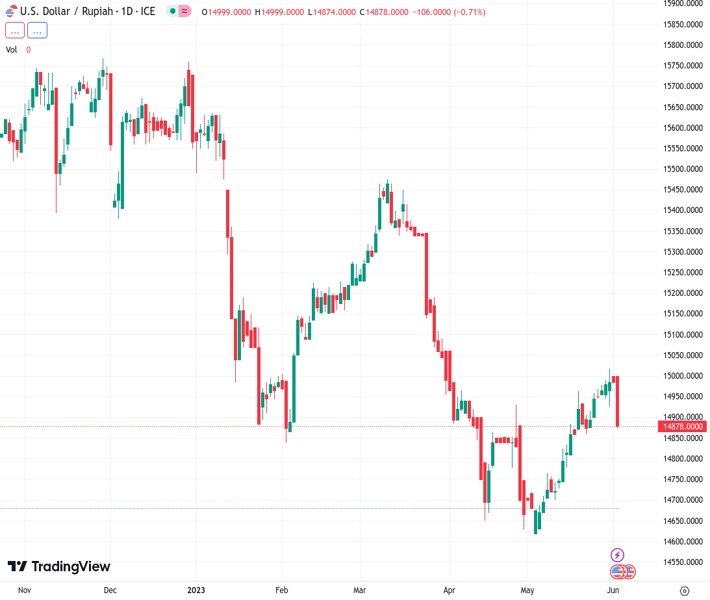
#USDIDR @ 14,879.0 has slipped below 14.87 after a wild move to near 14.90 after softening of Indonesian inflation. (Pivot Orderbook analysis)
…
This is a premium post.
[s2If !current_user_can(access_s2member_level4)]Please register for FREE REGISTER to read full post below containing analysis. In case of any error or you think you are not able to read the full post below, please email us at support#nehcap.com [lwa][/s2If] [s2If current_user_can(access_s2member_level1)]
- USD/IDR has slipped below 14.87 after a wild move to near 14.90 after softening of Indonesian inflation.
- Indonesian headline and core CPI softened to 4.0% and 2.66% respectively.
- Upbeat US Employment data has made the battle against stubborn inflation extremely complicated.
The pair currently trades last at 14879.0.
The previous day high was 14929.55 while the previous day low was 14784.5. The daily 38.2% Fib levels comes at 14839.9091, expected to provide support. Similarly, the daily 61.8% fib level is at 14874.1409, expected to provide support.
The USD/IDR pair traded volatile after softening of Indonesian inflation in the Asian session. The asset displayed a wild gyration in an attempt to capture the critical resistance of 15.00 but dropped back to the square near 14.87.
Statistics Indonesia reported headline inflation at 4.0% vs. the estimates of 4.23% and the former release of 4.33%. The monthly headline Consumer Price Index (CPI) figure accelerated by 0.009% at a slower pace in comparison to the street’s estimates of 0.3% and the prior release of 0.33%. Core inflation that strips off the impact of oil and food prices decelerated to 2.66% against the consensus of 2.8% and the former release of 2.83%.
S&P500 futures are carrying nominal losses in the early European session, indicating a minor caution in the overall upbeat market mood. US equities are expected to capture annual highs amid optimism fueled by the clearance of the US debt-ceiling bill in Congress, which has faded fears of a default by the US economy.
Meanwhile, the US Dollar Index (DXY) is displaying a back-and-forth action below 140.20. More upside in the USD Index seems favored as the Federal Reserve (Fed) is expected to raise interest rates further to scale down fears of a rebound in the United States inflation. US Employment data released on Friday has made the battle against stubborn inflation extremely complicated as firms have continued their recruitment process despite higher interest rates by the Fed and tight credit conditions by US regional banks. However, the Unemployment Rate rose to 3.7%.
On Monday, US ISM Services PMI (May) will be keenly watched. The economic data is seen declining to 51.5 vs. the prior release of 51.9. New Orders Index that displays forward demand is seen advancing to 56.5 against the former release of 56.1.
Technical Levels: Supports and Resistances
USDIDR currently trading at 14880.7 at the time of writing. Pair opened at 14902.0 and is trading with a change of -0.14 % .
| Overview | Overview.1 | |
|---|---|---|
| 0 | Today last price | 14880.70 |
| 1 | Today Daily Change | -21.30 |
| 2 | Today Daily Change % | -0.14 |
| 3 | Today daily open | 14902.00 |
The pair is trading below its 20 Daily moving average @ 14880.97, above its 50 Daily moving average @ 14877.375 , below its 100 Daily moving average @ 15038.2815 and below its 200 Daily moving average @ 15223.2412
| Trends | Trends.1 | |
|---|---|---|
| 0 | Daily SMA20 | 14880.9700 |
| 1 | Daily SMA50 | 14877.3750 |
| 2 | Daily SMA100 | 15038.2815 |
| 3 | Daily SMA200 | 15223.2412 |
The previous day high was 14929.55 while the previous day low was 14784.5. The daily 38.2% Fib levels comes at 14839.9091, expected to provide support. Similarly, the daily 61.8% fib level is at 14874.1409, expected to provide support.
Note the levels of interest below:
- Pivot support is noted at 14814.4833, 14726.9667, 14669.4333
- Pivot resistance is noted at 14959.5333, 15017.0667, 15104.5833
| Levels | Levels.1 |
|---|---|
| Previous Daily High | 14929.5500 |
| Previous Daily Low | 14784.5000 |
| Previous Weekly High | 15029.0500 |
| Previous Weekly Low | 14784.5000 |
| Previous Monthly High | 15029.0500 |
| Previous Monthly Low | 14571.8000 |
| Daily Fibonacci 38.2% | 14839.9091 |
| Daily Fibonacci 61.8% | 14874.1409 |
| Daily Pivot Point S1 | 14814.4833 |
| Daily Pivot Point S2 | 14726.9667 |
| Daily Pivot Point S3 | 14669.4333 |
| Daily Pivot Point R1 | 14959.5333 |
| Daily Pivot Point R2 | 15017.0667 |
| Daily Pivot Point R3 | 15104.5833 |
[/s2If]
Nehcap Expert Advisor
The NEHCAP MT4 EA is high quality professional trading system geared to generate returns without using GRID or martingales. Each trade has strict risk per trade parameter. The pairs under management include EURUSD, GBPUSD, AUDCAD, AUDNZD,GBPAUD, EURAUD, EURCAD, CHFJPY and many more.
The system is trading live: LIVE ACCOUNT TRACKING
You can run it free. Apply for a free trial and track our account. Buy the system or use profit share mechanism to generate returns on your MT4.
Join Our Telegram Group
")


