#USDCHF @ 0.90998 grinds higher after bouncing off 0.9040 support confluence, mildly bid of late., @nehcap view: Limited upside expected (Pivot Orderbook analysis)
…
This is a premium post.
[s2If !current_user_can(access_s2member_level4)]Please register for FREE REGISTER to read full post below containing analysis. In case of any error or you think you are not able to read the full post below, please email us at support#nehcap.com [lwa][/s2If] [s2If current_user_can(access_s2member_level1)]
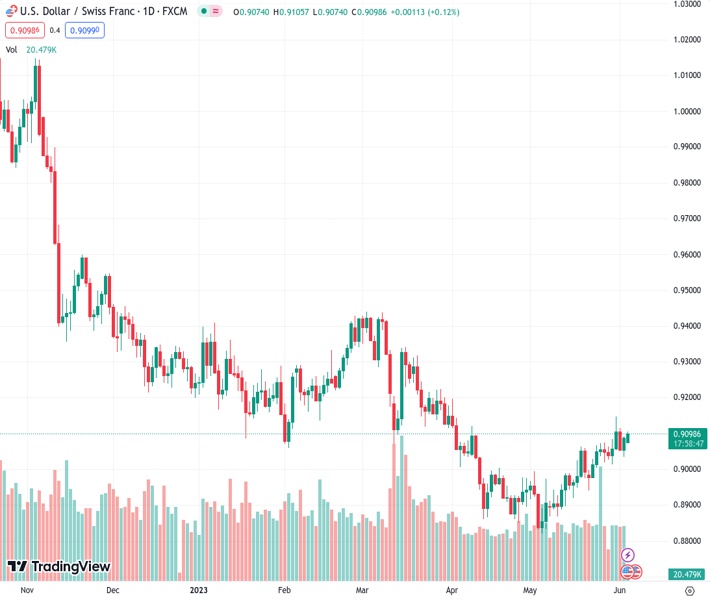
- USD/CHF grinds higher after bouncing off 0.9040 support confluence, mildly bid of late.
- 50-EMA, one-month-old rising trend line prods bears amid upbeat oscillators.
- Bulls have a tough road to travel amid presence of multiple EMAs, horizontal resistance.
The pair currently trades last at 0.90998.
The previous day high was 0.9093 while the previous day low was 0.9035. The daily 38.2% Fib levels comes at 0.9071, expected to provide support. Similarly, the daily 61.8% fib level is at 0.9057, expected to provide support.
USD/CHF picks up bids to 0.9105 as it clings to mild gains around 0.9100 during early Monday morning in Europe. In doing so, the Swiss Franc (CHF) pair rises for the second consecutive day while defending the previous day’s rebound from the 0.9040 support confluence.
That said, a convergence of the 50-day Exponential Moving Average (EMA) and an upward-sloping trend line from early May, facilitates the USD/CHF pair’s recovery amid bullish MACD signals and a firmer RSI (14) line, not overbought.
With this, the USD/CHF is likely to conquer the 10-week-old horizontal resistance area, as well as the 100-EMA, respectively around 0.9120 and 0.9130.
However, the RSI line is near the overbought territory and may prod the upside limit in case of the Swiss Franc (CHF) pair’s further upside, which in turn can challenge the USD/CHF bulls afterward.
In a case where the USD/CHF buyers remain hopeful past 0.9130, the late March swing high of around 0.9225 and the 200-EMA level of 0.9260 will challenge the pair buyers.
On the flip side, a daily closing below the aforementioned support confluence near 0.9040 can quickly fetch the USD/CHF price towards the 0.9000 round figure.
It’s worth noting, however, that the USD/CHF pair’s weakness past 0.9000 will make it vulnerable to revisiting the yearly low marked in May around 0.88220.
Trend: Limited upside expected
Technical Levels: Supports and Resistances
USDCHF currently trading at 0.9102 at the time of writing. Pair opened at 0.9092 and is trading with a change of 0.11% % .
| Overview | Overview.1 | |
|---|---|---|
| 0 | Today last price | 0.9102 |
| 1 | Today Daily Change | 0.0010 |
| 2 | Today Daily Change % | 0.11% |
| 3 | Today daily open | 0.9092 |
The pair is trading above its 20 Daily moving average @ 0.9004, above its 50 Daily moving average @ 0.9001 , below its 100 Daily moving average @ 0.9127 and below its 200 Daily moving average @ 0.9376
| Trends | Trends.1 | |
|---|---|---|
| 0 | Daily SMA20 | 0.9004 |
| 1 | Daily SMA50 | 0.9001 |
| 2 | Daily SMA100 | 0.9127 |
| 3 | Daily SMA200 | 0.9376 |
The previous day high was 0.9093 while the previous day low was 0.9035. The daily 38.2% Fib levels comes at 0.9071, expected to provide support. Similarly, the daily 61.8% fib level is at 0.9057, expected to provide support.
Note the levels of interest below:
- Pivot support is noted at 0.9054, 0.9015, 0.8996
- Pivot resistance is noted at 0.9112, 0.9131, 0.917
| Levels | Levels.1 |
|---|---|
| Previous Daily High | 0.9093 |
| Previous Daily Low | 0.9035 |
| Previous Weekly High | 0.9148 |
| Previous Weekly Low | 0.9014 |
| Previous Monthly High | 0.9148 |
| Previous Monthly Low | 0.8820 |
| Daily Fibonacci 38.2% | 0.9071 |
| Daily Fibonacci 61.8% | 0.9057 |
| Daily Pivot Point S1 | 0.9054 |
| Daily Pivot Point S2 | 0.9015 |
| Daily Pivot Point S3 | 0.8996 |
| Daily Pivot Point R1 | 0.9112 |
| Daily Pivot Point R2 | 0.9131 |
| Daily Pivot Point R3 | 0.9170 |
[/s2If]
Nehcap Expert Advisor
The NEHCAP MT4 EA is high quality professional trading system geared to generate returns without using GRID or martingales. Each trade has strict risk per trade parameter. The pairs under management include EURUSD, GBPUSD, AUDCAD, AUDNZD,GBPAUD, EURAUD, EURCAD, CHFJPY and many more.
The system is trading live: LIVE ACCOUNT TRACKING
You can run it free. Apply for a free trial and track our account. Buy the system or use profit share mechanism to generate returns on your MT4.
Join Our Telegram Group
")


