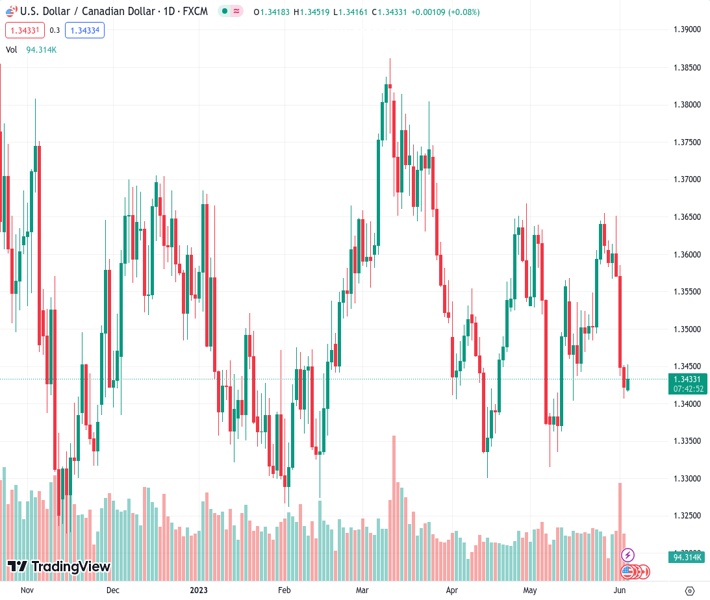
#USDCAD @ 1.34333 is oscillating in a narrow range around 1.3450 as the BoC policy comes under the picture. (Pivot Orderbook analysis)
…
This is a premium post.
[s2If !current_user_can(access_s2member_level4)]Please register for FREE REGISTER to read full post below containing analysis. In case of any error or you think you are not able to read the full post below, please email us at support#nehcap.com [lwa][/s2If] [s2If current_user_can(access_s2member_level1)]
- USD/CAD is oscillating in a narrow range around 1.3450 as the BoC policy comes under the picture.
- The upside in the Lonnie asset is restricted by upbeat oil prices while the downside is being supported by a solid US Dollar.
- The BoC is expected to keep interest rates steady at 4.5% as Canada’s inflation has been steadily declining.
The pair currently trades last at 1.34333.
The previous day high was 1.3452 while the previous day low was 1.3407. The daily 38.2% Fib levels comes at 1.3424, expected to provide support. Similarly, the daily 61.8% fib level is at 1.3435, expected to provide resistance.
The USD/CAD pair is consistently showing back-and-forth action around 1.3430 in the early New York session. The Loonie asset is struggling to deliver a decisive move as investors are shifting their focus toward the interest rate decision by the Bank of Canada (BoC), which will be announced on Wednesday.
S&P500 futures are showing nominal gains before the opening of the American session. The overall market mood is quite upbeat as the Federal government has successfully eradicated the case of a default by the United States economy.
The US Dollar Index (DXY) has registered a fresh day’s high at 104.40. Investors are gung-ho for the USD Index as consistent higher additions of fresh payrolls in the US labor market is supporting hopes of the continuation of the policy-tightening spell by the Federal Reserve (Fed).
It is worth noting that the Loonie asset is inside the woods despite sheer strength in the USD Index, which indicates that the Canadian Dollar is also strong.
The trigger that has been supporting the Canadian Dollar is the upbeat oil prices after the announcement of fresh oil production cuts seldom by Saudi Arabia. Saudi Arabia’s Energy Minister, Prince Abdulaziz bin Salman, said on Sunday, “Saudi Arabia to make extra 1 million b/d output cut from July.” He further added the Kingdom will extend its 500k barrels per day (b/d) voluntary cut until the end of 2024.
Investors should note that Canada is the leading exporter of oil to the United States and higher oil prices are supporting the Canadian Dollar.
This week, the interest rate policy by the BoC will be keenly watched. BoC Governor Tiff Macklem is expected to keep interest rates steady at 4.5% as Canada’s inflation has been steadily declining. In April, Canada’s inflation was recorded at 4.4%.
Technical Levels: Supports and Resistances
USDCAD currently trading at 1.3439 at the time of writing. Pair opened at 1.3425 and is trading with a change of 0.1 % .
| Overview | Overview.1 | |
|---|---|---|
| 0 | Today last price | 1.3439 |
| 1 | Today Daily Change | 0.0014 |
| 2 | Today Daily Change % | 0.1000 |
| 3 | Today daily open | 1.3425 |
The pair remains strongly bearish on the daily time frame. It trades below the 20 SMA @ 1.3505, 50 SMA 1.3507, 100 SMA @ 1.3518 and 200 SMA @ 1.3507.
| Trends | Trends.1 | |
|---|---|---|
| 0 | Daily SMA20 | 1.3505 |
| 1 | Daily SMA50 | 1.3507 |
| 2 | Daily SMA100 | 1.3518 |
| 3 | Daily SMA200 | 1.3507 |
The previous day high was 1.3452 while the previous day low was 1.3407. The daily 38.2% Fib levels comes at 1.3424, expected to provide support. Similarly, the daily 61.8% fib level is at 1.3435, expected to provide resistance.
Note the levels of interest below:
- Pivot support is noted at 1.3404, 1.3383, 1.3358
- Pivot resistance is noted at 1.345, 1.3474, 1.3495
| Levels | Levels.1 |
|---|---|
| Previous Daily High | 1.3452 |
| Previous Daily Low | 1.3407 |
| Previous Weekly High | 1.3651 |
| Previous Weekly Low | 1.3407 |
| Previous Monthly High | 1.3655 |
| Previous Monthly Low | 1.3315 |
| Daily Fibonacci 38.2% | 1.3424 |
| Daily Fibonacci 61.8% | 1.3435 |
| Daily Pivot Point S1 | 1.3404 |
| Daily Pivot Point S2 | 1.3383 |
| Daily Pivot Point S3 | 1.3358 |
| Daily Pivot Point R1 | 1.3450 |
| Daily Pivot Point R2 | 1.3474 |
| Daily Pivot Point R3 | 1.3495 |
[/s2If]
Nehcap Expert Advisor
The NEHCAP MT4 EA is high quality professional trading system geared to generate returns without using GRID or martingales. Each trade has strict risk per trade parameter. The pairs under management include EURUSD, GBPUSD, AUDCAD, AUDNZD,GBPAUD, EURAUD, EURCAD, CHFJPY and many more.
The system is trading live: LIVE ACCOUNT TRACKING
You can run it free. Apply for a free trial and track our account. Buy the system or use profit share mechanism to generate returns on your MT4.
Join Our Telegram Group
")


