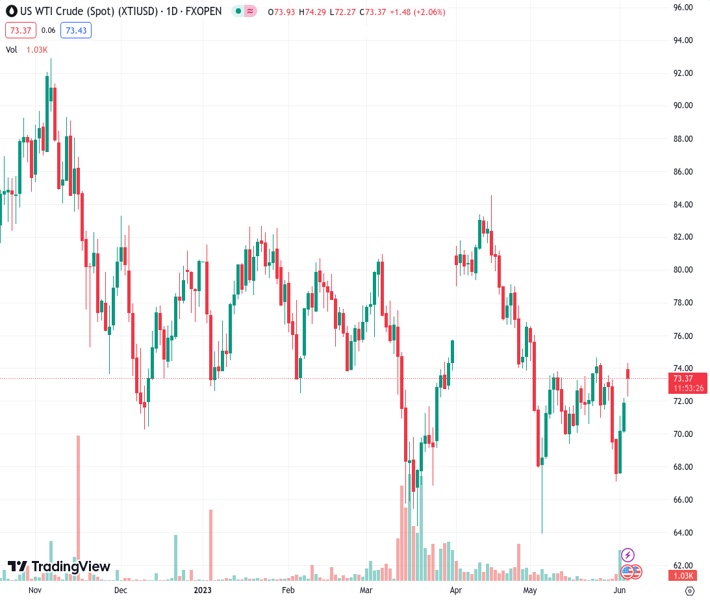
The oil price has extended its recovery above $73.20 as fresh supply cuts would impact the demand-supply parity. (Pivot Orderbook analysis)
…
This is a premium post.
[s2If !current_user_can(access_s2member_level4)]Please register for FREE REGISTER to read full post below containing analysis. In case of any error or you think you are not able to read the full post below, please email us at support#nehcap.com [lwa][/s2If] [s2If current_user_can(access_s2member_level1)]
- The oil price has extended its recovery above $73.20 as fresh supply cuts would impact the demand-supply parity.
- Higher odds of a stable Fed policy and a recovery in Chinese factory activity are supporting the oil price.
- The investing community is divided between a higher United States Unemployment Rate and higher payroll additions.
The pair currently trades last at 73.24.
The previous day high was 72.21 while the previous day low was 70.06. The daily 38.2% Fib levels comes at 71.39, expected to provide support. Similarly, the daily 61.8% fib level is at 70.88, expected to provide support.
West Texas Intermediate (WTI), futures on NYMEX, rebounded firmly after defending the downside near $72.22 in Asia. The oil price has extended its recovery above $73.20 in Europe as the announcement of fresh cuts in oil production solely by Saudi Arabia is going to tweak the current supply-demand mechanism.
On the weekend, Saudi Arabia’s Energy Minister, Prince Abdulaziz bin Salman, said on Sunday, “Saudi Arabia to make extra 1 million b/d output cut from July.” He further added the Kingdom will extend its 500k barrels per day (b/d) voluntary cut until the end of 2024.
The continuous decline in oil prices by the oil cartel in a way to provide cushion to energy prices indicates that the oil demand outlook is extremely bleak and back-to-back supply cuts are the only method for supporting prices.
In China, recovery in factory activity communicated by IHS Markit through Caixin Manufacturing PMI has fueled some optimism among investors. The economic data managed to defend the 50.0 threshold and landed at 50.9, higher than the consensus and the prior release of 49.5. Investors should note that China is the largest importer of oil in the world and higher manufacturing activity in China strengthens the oil demand outlook.
Meanwhile, the US Dollar Index (DXY) is hovering near its intraday high around 104.32 as hawkish Federal Reserve (Fed) bets are consistently providing the required support. The investing community is divided between a higher United States Unemployment Rate and higher payroll additions. According to the CME Fedwatch tool, more than 86% of the chances are in favor of a stable interest rate decision.
Technical Levels: Supports and Resistances
XTIUSD currently trading at 73.24 at the time of writing. Pair opened at 71.91 and is trading with a change of 1.85 % .
| Overview | Overview.1 | |
|---|---|---|
| 0 | Today last price | 73.24 |
| 1 | Today Daily Change | 1.33 |
| 2 | Today Daily Change % | 1.85 |
| 3 | Today daily open | 71.91 |
The pair is trading above its 20 Daily moving average @ 71.8, below its 50 Daily moving average @ 74.78 , below its 100 Daily moving average @ 75.71 and below its 200 Daily moving average @ 79.07
| Trends | Trends.1 | |
|---|---|---|
| 0 | Daily SMA20 | 71.80 |
| 1 | Daily SMA50 | 74.78 |
| 2 | Daily SMA100 | 75.71 |
| 3 | Daily SMA200 | 79.07 |
The previous day high was 72.21 while the previous day low was 70.06. The daily 38.2% Fib levels comes at 71.39, expected to provide support. Similarly, the daily 61.8% fib level is at 70.88, expected to provide support.
Note the levels of interest below:
- Pivot support is noted at 70.58, 69.24, 68.43
- Pivot resistance is noted at 72.73, 73.55, 74.88
| Levels | Levels.1 |
|---|---|
| Previous Daily High | 72.21 |
| Previous Daily Low | 70.06 |
| Previous Weekly High | 73.58 |
| Previous Weekly Low | 67.12 |
| Previous Monthly High | 76.61 |
| Previous Monthly Low | 64.31 |
| Daily Fibonacci 38.2% | 71.39 |
| Daily Fibonacci 61.8% | 70.88 |
| Daily Pivot Point S1 | 70.58 |
| Daily Pivot Point S2 | 69.24 |
| Daily Pivot Point S3 | 68.43 |
| Daily Pivot Point R1 | 72.73 |
| Daily Pivot Point R2 | 73.55 |
| Daily Pivot Point R3 | 74.88 |
[/s2If]
Nehcap Expert Advisor
The NEHCAP MT4 EA is high quality professional trading system geared to generate returns without using GRID or martingales. Each trade has strict risk per trade parameter. The pairs under management include EURUSD, GBPUSD, AUDCAD, AUDNZD,GBPAUD, EURAUD, EURCAD, CHFJPY and many more.
The system is trading live: LIVE ACCOUNT TRACKING
You can run it free. Apply for a free trial and track our account. Buy the system or use profit share mechanism to generate returns on your MT4.
Join Our Telegram Group
")


