#EURUSD @ 1.07178 Euro rises on weakening US factory orders and a mixed ISM reading, with trading above the opening price. (Pivot Orderbook analysis)
…
This is a premium post.
[s2If !current_user_can(access_s2member_level4)]Please register for FREE REGISTER to read full post below containing analysis. In case of any error or you think you are not able to read the full post below, please email us at support#nehcap.com [lwa][/s2If] [s2If current_user_can(access_s2member_level1)]
- Euro rises on weakening US factory orders and a mixed ISM reading, with EUR/USD trading above the opening price.
- Wall Street displays mixed sentiment as fears of recession loom following 7th straight month of contracting Manufacturing PMI.
- Hawkish comments from ECB officials, boost the Euro against the backdrop of a sluggish US economy.
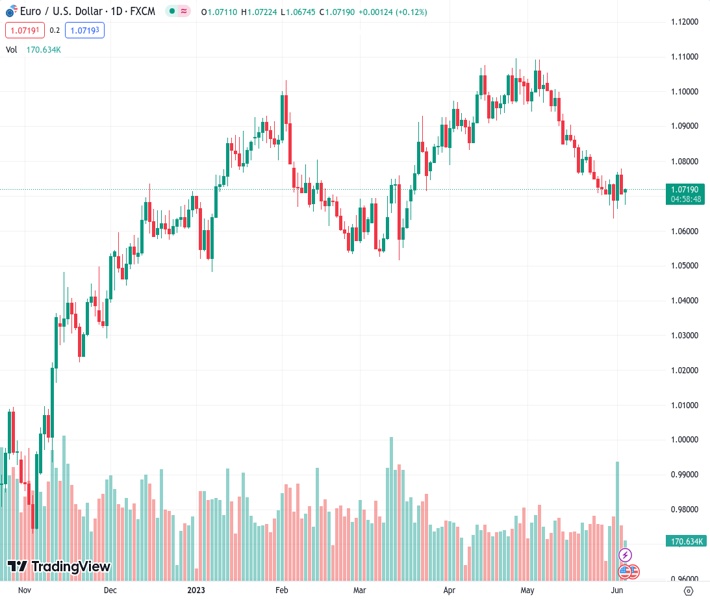
The pair currently trades last at 1.07178.
The previous day high was 1.0779 while the previous day low was 1.0705. The daily 38.2% Fib levels comes at 1.0733, expected to provide resistance. Similarly, the daily 61.8% fib level is at 1.0751, expected to provide resistance.
EUR/USD erases some of its previous losses, sponsored by weaker orders in factories in the United States (US), alongside mixed ISM readings. European Central Bank President Christine Lagarde and other policymakers’ hawkish comments also lifted the Euro (EUR). The EUR/USD is trading at 1.0710, above its opening price by 0.01%.
Market sentiment is fragile, as shown by Wall Street trading mixed. Factory Orders in the United States slowed down in April, from 0.6% in the prior month, to 0.4%, beneath expectations for a solid 0.8% figure. Excluding transportation, plunged -0.2%, a slight improvement from March -0.7% fall. That, alongside further economic data from the US, underpinned the EUR/USD, which gained 27 pips in the latest 50 minutes of trading, claiming the 1.0700 mark.
The Institute for Supply Management (ISM) revealed that the Non-Manufacturing PMI, also known as the Services PMI, dropped to 50.3 in May from April 51.9, clung to expansionary territory amidst a slowdown in orders. Given that the PMI decelerated, increased fears for a possible recession after the last week’s Manufacturing PMI contracted for the seventh straight month.
Meanwhile, the US Dollar Index (DXY), a measure of the buck’s value vs. a basket of currencies, pairs earlier losses at 104.060, positive by 0.02%, capping the EUR/USD’s rally amidst falling US Treasury bond yields. The US 10-year benchmark note rate sits at 3.693%, almost flat.
On the European front, business activity in May, particularly the S&& Global Services PMI, decelerated but offset the plunge in manufacturing activity. Meanwhile, ECB speakers crossed newswires, led by its President Lagarde, who said that the central bank would stop all reinvestments in APP. Lagarde added that although there are signs of moderation, “there is no clear evidence that underlying inflation has peaked,” told European lawmakers.
At the same time, her colleague Joachim Nagler added the ECB needs to keep raining rates beyond the summer. Money market futures have priced in a 25 bps rate hike by the ECB, contrarily to the US Federal Reserve (Fed), which is seen pausing in June, but if data proves them wrong, another interest rate increase is expected in July.
From a technical perspective, the EUR/USD is neutral to downward biased, though testes briefly the 200-day Exponential Moving Average (EMA) at 1.0687, though bounced for the third time. Nevertheless, the Relative Strength Index (RSI) and the 3-day Rate of Change (RoC) are bearish, suggesting sellers remain in charge.
Downside risks lie at the 1.0700 figure. Break below will expose the 200-day EMA, followed by the May 31 low of 1.0635. on the flip side, the EUR/USD first resistance would be the 100-day EMA at 1.0769, the 20-day EMA at 1.0788, and the 1.0800 figure.
Technical Levels: Supports and Resistances
EURUSD currently trading at 1.071 at the time of writing. Pair opened at 1.0708 and is trading with a change of 0.02 % .
| Overview | Overview.1 | |
|---|---|---|
| 0 | Today last price | 1.0710 |
| 1 | Today Daily Change | 0.0002 |
| 2 | Today Daily Change % | 0.0200 |
| 3 | Today daily open | 1.0708 |
The pair is trading below its 20 Daily moving average @ 1.0813, below its 50 Daily moving average @ 1.0897 , below its 100 Daily moving average @ 1.0813 and above its 200 Daily moving average @ 1.0502
| Trends | Trends.1 | |
|---|---|---|
| 0 | Daily SMA20 | 1.0813 |
| 1 | Daily SMA50 | 1.0897 |
| 2 | Daily SMA100 | 1.0813 |
| 3 | Daily SMA200 | 1.0502 |
The previous day high was 1.0779 while the previous day low was 1.0705. The daily 38.2% Fib levels comes at 1.0733, expected to provide resistance. Similarly, the daily 61.8% fib level is at 1.0751, expected to provide resistance.
Note the levels of interest below:
- Pivot support is noted at 1.0682, 1.0657, 1.0609
- Pivot resistance is noted at 1.0756, 1.0804, 1.083
| Levels | Levels.1 |
|---|---|
| Previous Daily High | 1.0779 |
| Previous Daily Low | 1.0705 |
| Previous Weekly High | 1.0779 |
| Previous Weekly Low | 1.0635 |
| Previous Monthly High | 1.1092 |
| Previous Monthly Low | 1.0635 |
| Daily Fibonacci 38.2% | 1.0733 |
| Daily Fibonacci 61.8% | 1.0751 |
| Daily Pivot Point S1 | 1.0682 |
| Daily Pivot Point S2 | 1.0657 |
| Daily Pivot Point S3 | 1.0609 |
| Daily Pivot Point R1 | 1.0756 |
| Daily Pivot Point R2 | 1.0804 |
| Daily Pivot Point R3 | 1.0830 |
[/s2If]
Nehcap Expert Advisor
The NEHCAP MT4 EA is high quality professional trading system geared to generate returns without using GRID or martingales. Each trade has strict risk per trade parameter. The pairs under management include EURUSD, GBPUSD, AUDCAD, AUDNZD,GBPAUD, EURAUD, EURCAD, CHFJPY and many more.
The system is trading live: LIVE ACCOUNT TRACKING
You can run it free. Apply for a free trial and track our account. Buy the system or use profit share mechanism to generate returns on your MT4.
Join Our Telegram Group
")


