#AUDUSD @ 0.66000 extends recovery from intraday low within bullish chart formation., @nehcap view: Further upside expected (Pivot Orderbook analysis)
…
This is a premium post.
[s2If !current_user_can(access_s2member_level4)]Please register for FREE REGISTER to read full post below containing analysis. In case of any error or you think you are not able to read the full post below, please email us at support#nehcap.com [lwa][/s2If] [s2If current_user_can(access_s2member_level1)]
- AUD/USD extends recovery from intraday low within bullish chart formation.
- China Caixin PMI, Australia TD Securities Inflation came in firmer for May.
- Sustained trading beyond key moving averages, upbeat RSI hints at confirmation of bullish pattern.
- Bull flag signals theoretical target of 0.6750, sellers need validation from 200-SMA.
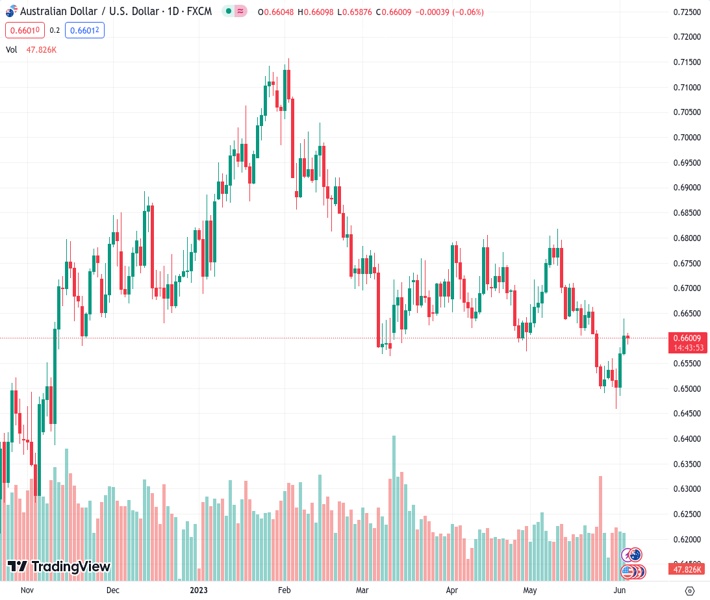
The pair currently trades last at 0.66000.
The previous day high was 0.6639 while the previous day low was 0.6565. The daily 38.2% Fib levels comes at 0.6611, expected to provide resistance. Similarly, the daily 61.8% fib level is at 0.6593, expected to provide support.
AUD/USD picks up bids to pare intraday losses around 0.6700 as it struggles to cheer upbeat catalysts at home amid early Monday in Europe. In doing so, the Aussie pair portrays the traders’ anxiety ahead of the key Reserve Bank of Australia (RBA) data.
That said, strong US Nonfarm Payrolls (NFP) teased Aussie pair sellers during the week-start trading before the firmer Australia-China data recall the buyers. Earlier in the day, China’s Caixin Services PMI matches 57.1 market forecasts for May versus 56.4 previous readings. Before that, Australia’s TD Securities Inflation rose 0.9% MoM in May versus 0.2%. However, the downbeat prints of the TD Securities Inflation on a YoY basis join a reduction in the nation’s Company Gross Operating Profits for the first quarter (Q1) to prod the bulls.
Apart from that, the top line of the short-term bull flag, around 0.67000 round figure by the press time, challenges the AUD/USD pair buyers.
However, the Aussie pair’s successful trading above the 200 and 100 SMAs, as well as a three-day-old rising support line, keeps the pair buyers hopeful of crossing the immediate 0.6700 hurdle, which in turn highlights a theoretical run-up towards the 0.6750 mark.
During the likely rise, highs marked on May 16 and 19, respectively near 0.6710 and 0.6675, can act as intermediate halts.
Meanwhile, 100-SMA joins the stated flag’s bottom line to highlight the 0.6580 level as the short-term key support.
Following that, the ascending support line from the last Wednesday, near 0.6570, followed by the 200-SMA level of near 0.6545, can act as the last defense of the AUD/USD bulls.
Trend: Further upside expected
Technical Levels: Supports and Resistances
AUDUSD currently trading at 0.6606 at the time of writing. Pair opened at 0.661 and is trading with a change of -0.06% % .
| Overview | Overview.1 | |
|---|---|---|
| 0 | Today last price | 0.6606 |
| 1 | Today Daily Change | -0.0004 |
| 2 | Today Daily Change % | -0.06% |
| 3 | Today daily open | 0.661 |
The pair remains strongly bearish on the daily time frame. It trades below the 20 SMA @ 0.6626, 50 SMA 0.6664, 100 SMA @ 0.6755 and 200 SMA @ 0.6695.
| Trends | Trends.1 | |
|---|---|---|
| 0 | Daily SMA20 | 0.6626 |
| 1 | Daily SMA50 | 0.6664 |
| 2 | Daily SMA100 | 0.6755 |
| 3 | Daily SMA200 | 0.6695 |
The previous day high was 0.6639 while the previous day low was 0.6565. The daily 38.2% Fib levels comes at 0.6611, expected to provide resistance. Similarly, the daily 61.8% fib level is at 0.6593, expected to provide support.
Note the levels of interest below:
- Pivot support is noted at 0.6571, 0.6531, 0.6497
- Pivot resistance is noted at 0.6644, 0.6678, 0.6718
| Levels | Levels.1 |
|---|---|
| Previous Daily High | 0.6639 |
| Previous Daily Low | 0.6565 |
| Previous Weekly High | 0.6639 |
| Previous Weekly Low | 0.6458 |
| Previous Monthly High | 0.6818 |
| Previous Monthly Low | 0.6458 |
| Daily Fibonacci 38.2% | 0.6611 |
| Daily Fibonacci 61.8% | 0.6593 |
| Daily Pivot Point S1 | 0.6571 |
| Daily Pivot Point S2 | 0.6531 |
| Daily Pivot Point S3 | 0.6497 |
| Daily Pivot Point R1 | 0.6644 |
| Daily Pivot Point R2 | 0.6678 |
| Daily Pivot Point R3 | 0.6718 |
[/s2If]
Nehcap Expert Advisor
The NEHCAP MT4 EA is high quality professional trading system geared to generate returns without using GRID or martingales. Each trade has strict risk per trade parameter. The pairs under management include EURUSD, GBPUSD, AUDCAD, AUDNZD,GBPAUD, EURAUD, EURCAD, CHFJPY and many more.
The system is trading live: LIVE ACCOUNT TRACKING
You can run it free. Apply for a free trial and track our account. Buy the system or use profit share mechanism to generate returns on your MT4.
Join Our Telegram Group
")


