#XAUUSD @ 1,948.40 Gold Price remains pressured towards short-term key support after snapping three-week downtrend with minor gains., @nehcap view: Limited downside expected (Pivot Orderbook analysis)
…
This is a premium post.
[s2If !current_user_can(access_s2member_level4)]Please register for FREE REGISTER to read full post below containing analysis. In case of any error or you think you are not able to read the full post below, please email us at support#nehcap.com [lwa][/s2If] [s2If current_user_can(access_s2member_level1)]
- Gold Price remains pressured towards short-term key support after snapping three-week downtrend with minor gains.
- XAU/USD bears cheer upbeat United States Nonfarm Payrolls favoring Federal Reserve hawks but employment details aren’t too impressive.
- US policymakers’ ability to avoid the ‘catastrophic’ default, absence of Fed talks ahead of FOCM may tease Gold buyers.
- China inflation, second-tier data may entertain XAU/USD traders amid a likely less volatile week.
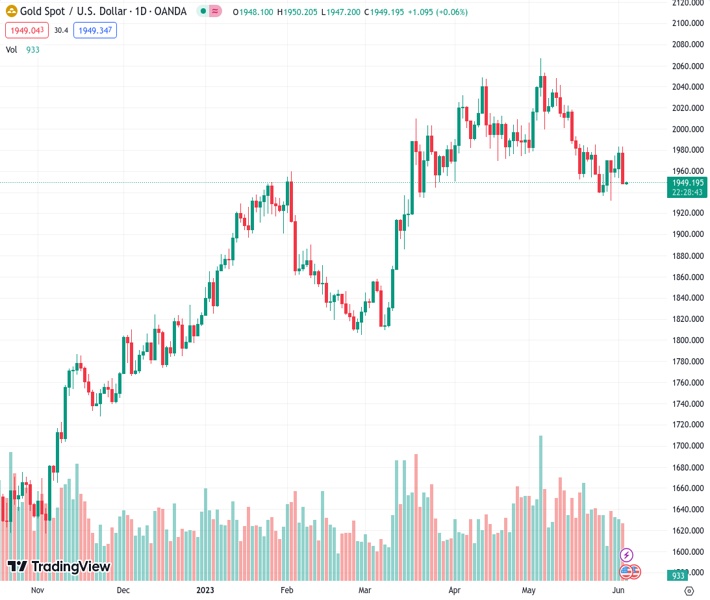
The pair currently trades last at 1948.40.
The previous day high was 1983.5 while the previous day low was 1947.56. The daily 38.2% Fib levels comes at 1961.29, expected to provide resistance. Similarly, the daily 61.8% fib level is at 1969.77, expected to provide resistance.
Gold Price (XAU/USD) bears the burden of fresh hawkish Federal Reserve (Fed) calls, especially after the strong United States Nonfarm Payrolls (NFP), as it slides below $1,950 amid early Monday morning in Asia. In doing so, the yellow metal holds onto the post-NFP losses despite posting the first weekly gain in four. That said, the pre-Fed blackout of policymakers may restrict the XAU/USD moves during the week while US ISM Services PMI and China inflation numbers may direct the Gold Price moves.
Gold Price marked the biggest daily slump in a month after the United States Nonfarm Payrolls (NFP) surprises markets with a strong number and bolstered the Federal Reserve (Fed). Even so, the XAU/USD snapped a three-week downtrend as market sentiment remains slightly positive. The reason could be linked to the mixed details of the US employment report for May.
On Friday, the US jobs report for May surprised markets with a jump in the headline Nonfarm Payrolls (NFP) by 339K versus 190K expected and 294K prior (revised). It’s worth noting, however, that the Unemployment Rate also rose to 3.7% from 3.4% prior, versus 3.5% market forecasts. It should be noted, that the Average Hourly Earnings eased whereas the Labor Force Participation Rate remain the same as previous.
It’s worth noting that the latest tension between the US and China, especially due to the Taiwan concerns, however, joins the likeliness of 25 basis points (bps) of the Federal Reserve (Fed) in June to exert downside pressure on the Gold Price.
While the United States labor market report defends downside bias for the Gold Price, the policymakers’ ability to avoid the ‘catastrophic’ default keeps the metal buyers hopeful, especially amid the downside US Dollar and Treasury bond yields.
After the US House of Representatives and Senate passes the debt-ceiling bill, the key agreement reached US President Joe Biden’s desk for signing and became the law before the June 05 deadline, avoiding the ‘catastrophic’ default. It should be noted, however, that the global rating agencies remain cautious despite the price-positive move. “Fitch Ratings said on Friday the United States’ “AAA” credit rating would remain on negative watch, despite the agreement that will allow the government to meet its obligations,” said Reuters.
Amid these plays, the United States Treasury bond yields and the US Dollar marked the first weekly loss in four while Wall Street closed on the positive side, which in turn keeps the riskier assets and the Gold Price on the buyer’s radar.
Looking forward, the Gold Price may witness hardships in extending the previous day’s losses as a lack of major data/events, as well as the cautious optimism in the market, may allow the XAU/USD to pare previous losses. That said, United States Factory Orders and ISM Services PMI may entertain the intraday Gold traders while China inflation and risk catalysts should be eyed afterward for clear directions.
Gold Price has a bumpy road to travel towards the south despite reversing from a 12-day-old horizontal resistance, around $1,985-87.
The reason could be linked to the below 50.0 levels of the Relative Strength Index (RSI) line, placed at 14, as well as an 11-week horizontal support zone near $1,937-32 that also comprises the previous resistance line stretched from early May.
Even if the XAU/USD breaks the aforementioned horizontal support zone, the 61.8% Fibonacci retracement level of its March-May upside, near $1,913, will precede the $1,900 round figure and the mid-March swing low of around $1,884 to challenge the Gold bears.
On the contrary, the Gold Price upside beyond the aforementioned horizontal resistance area surrounding $1,985-87 isn’t an open invitation to the buyers as the 200-bar SMA level of around $1,990 and the $2,000 psychological magnet can restrict the bullion’s north-run.
In a case where the XAU/USD remains firmer past $2,000, multiple hurdles near $,2010 and $2,050 can act as the last defenses of the bears.
Overall, Gold prices appear to have limited downside room and can lure the short-term recovery.
Trend: Limited downside expected
Technical Levels: Supports and Resistances
XAUUSD currently trading at 1949.92 at the time of writing. Pair opened at 1948.02 and is trading with a change of 0.10% % .
| Overview | Overview.1 | |
|---|---|---|
| 0 | Today last price | 1949.92 |
| 1 | Today Daily Change | 1.90 |
| 2 | Today Daily Change % | 0.10% |
| 3 | Today daily open | 1948.02 |
The pair is trading below its 20 Daily moving average @ 1980.91, below its 50 Daily moving average @ 1991.4 , above its 100 Daily moving average @ 1939.1 and above its 200 Daily moving average @ 1835.68
| Trends | Trends.1 | |
|---|---|---|
| 0 | Daily SMA20 | 1980.91 |
| 1 | Daily SMA50 | 1991.40 |
| 2 | Daily SMA100 | 1939.10 |
| 3 | Daily SMA200 | 1835.68 |
The previous day high was 1983.5 while the previous day low was 1947.56. The daily 38.2% Fib levels comes at 1961.29, expected to provide resistance. Similarly, the daily 61.8% fib level is at 1969.77, expected to provide resistance.
Note the levels of interest below:
- Pivot support is noted at 1935.89, 1923.75, 1899.95
- Pivot resistance is noted at 1971.83, 1995.63, 2007.77
| Levels | Levels.1 |
|---|---|
| Previous Daily High | 1983.50 |
| Previous Daily Low | 1947.56 |
| Previous Weekly High | 1983.50 |
| Previous Weekly Low | 1932.12 |
| Previous Monthly High | 2079.76 |
| Previous Monthly Low | 1932.12 |
| Daily Fibonacci 38.2% | 1961.29 |
| Daily Fibonacci 61.8% | 1969.77 |
| Daily Pivot Point S1 | 1935.89 |
| Daily Pivot Point S2 | 1923.75 |
| Daily Pivot Point S3 | 1899.95 |
| Daily Pivot Point R1 | 1971.83 |
| Daily Pivot Point R2 | 1995.63 |
| Daily Pivot Point R3 | 2007.77 |
[/s2If]
Nehcap Expert Advisor
The NEHCAP MT4 EA is high quality professional trading system geared to generate returns without using GRID or martingales. Each trade has strict risk per trade parameter. The pairs under management include EURUSD, GBPUSD, AUDCAD, AUDNZD,GBPAUD, EURAUD, EURCAD, CHFJPY and many more.
The system is trading live: LIVE ACCOUNT TRACKING
You can run it free. Apply for a free trial and track our account. Buy the system or use profit share mechanism to generate returns on your MT4.
Join Our Telegram Group
")


