#NZDUSD @ 0.60610 remains pressured after reversing from one-week high, sidelined amid NZ holiday., @nehcap view: Further downside expected (Pivot Orderbook analysis)
…
This is a premium post.
[s2If !current_user_can(access_s2member_level4)]Please register for FREE REGISTER to read full post below containing analysis. In case of any error or you think you are not able to read the full post below, please email us at support#nehcap.com [lwa][/s2If] [s2If current_user_can(access_s2member_level1)]
- NZD/USD remains pressured after reversing from one-week high, sidelined amid NZ holiday.
- Failure to extend corrective bounce off seven-month low keeps Kiwi bears hopeful.
- RSI, MACD conditions prod further downside but 10-DMA, previous support line restricts buyers from taking control.
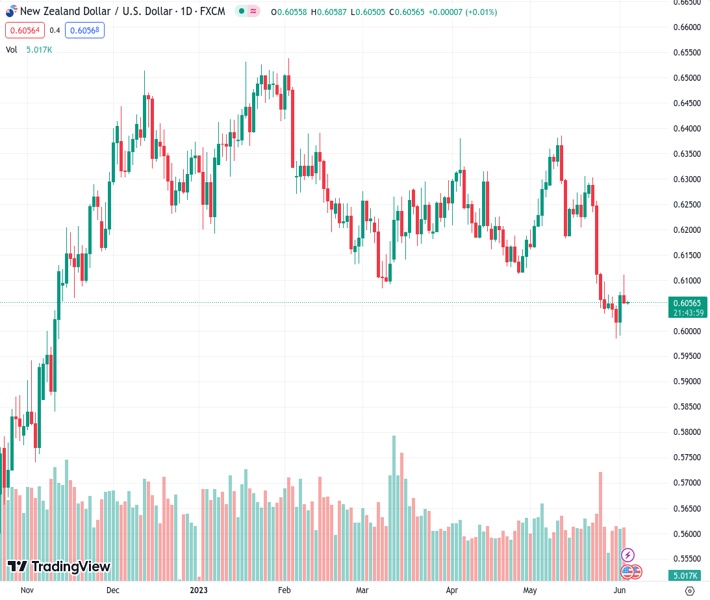
The pair currently trades last at 0.60610.
The previous day high was 0.6112 while the previous day low was 0.6055. The daily 38.2% Fib levels comes at 0.6077, expected to provide resistance. Similarly, the daily 61.8% fib level is at 0.609, expected to provide resistance.
NZD/USD fades bounce off the lowest levels in seven months, keeping the previous day’s retreat, as it holds lower grounds near 0.6060 amid early Monday morning in Asia. In doing so, the Kiwi pair portrays the quote’s inability to defend the previous week’s corrective bounce off the multi-day low amid failure to cross the key support-turned-resistance line and the 10-DMA.
Apart from the 10-DMA and the previous support line stretched from November 2022, respectively near 0.6060 and 0.6110, the absence of New Zealand (NZ) traders due to the holidays in Auckland also allow the Kiwi pair to continue extending the previous losses.
However, the nearly oversold RSI (14) line and the looming bull cross on the MACD allow the NZD/USD to pare previous losses in a case where the quote manages to stay firmer past the aforementioned key resistances, namely near 0.6060 and 0.6110.
In a case where the NZD/USD price remains firmer past 0.6110, the odds of witnessing a run-up towards the mid-May swing low, around 0.6185, can’t be ruled out.
Following that, the May 19 peak of around 0.6310 could entertain the Kiwi pair buyers before directing them to a four-month-old horizontal resistance area surrounding 0.6390.
On the contrary, pullback moves may initially aim for the 50% Fibonacci retracement level of its October 2022 to February 2023 upside, near 0.6025, before challenging the 0.6000 round figure.
It’s worth observing that the NZD/USD downside past the 0.6000 support needs to remain below the latest swing low of around 0.5985 to keep the bears on board.
Trend: Further downside expected
Technical Levels: Supports and Resistances
NZDUSD currently trading at 0.6057 at the time of writing. Pair opened at 0.6061 and is trading with a change of -0.07% % .
| Overview | Overview.1 | |
|---|---|---|
| 0 | Today last price | 0.6057 |
| 1 | Today Daily Change | -0.0004 |
| 2 | Today Daily Change % | -0.07% |
| 3 | Today daily open | 0.6061 |
The pair remains strongly bearish on the daily time frame. It trades below the 20 SMA @ 0.6181, 50 SMA 0.6204, 100 SMA @ 0.625 and 200 SMA @ 0.615.
| Trends | Trends.1 | |
|---|---|---|
| 0 | Daily SMA20 | 0.6181 |
| 1 | Daily SMA50 | 0.6204 |
| 2 | Daily SMA100 | 0.6250 |
| 3 | Daily SMA200 | 0.6150 |
The previous day high was 0.6112 while the previous day low was 0.6055. The daily 38.2% Fib levels comes at 0.6077, expected to provide resistance. Similarly, the daily 61.8% fib level is at 0.609, expected to provide resistance.
Note the levels of interest below:
- Pivot support is noted at 0.604, 0.6019, 0.5983
- Pivot resistance is noted at 0.6097, 0.6133, 0.6154
| Levels | Levels.1 |
|---|---|
| Previous Daily High | 0.6112 |
| Previous Daily Low | 0.6055 |
| Previous Weekly High | 0.6112 |
| Previous Weekly Low | 0.5985 |
| Previous Monthly High | 0.6385 |
| Previous Monthly Low | 0.5985 |
| Daily Fibonacci 38.2% | 0.6077 |
| Daily Fibonacci 61.8% | 0.6090 |
| Daily Pivot Point S1 | 0.6040 |
| Daily Pivot Point S2 | 0.6019 |
| Daily Pivot Point S3 | 0.5983 |
| Daily Pivot Point R1 | 0.6097 |
| Daily Pivot Point R2 | 0.6133 |
| Daily Pivot Point R3 | 0.6154 |
[/s2If]
Nehcap Expert Advisor
The NEHCAP MT4 EA is high quality professional trading system geared to generate returns without using GRID or martingales. Each trade has strict risk per trade parameter. The pairs under management include EURUSD, GBPUSD, AUDCAD, AUDNZD,GBPAUD, EURAUD, EURCAD, CHFJPY and many more.
The system is trading live: LIVE ACCOUNT TRACKING
You can run it free. Apply for a free trial and track our account. Buy the system or use profit share mechanism to generate returns on your MT4.
Join Our Telegram Group
")


