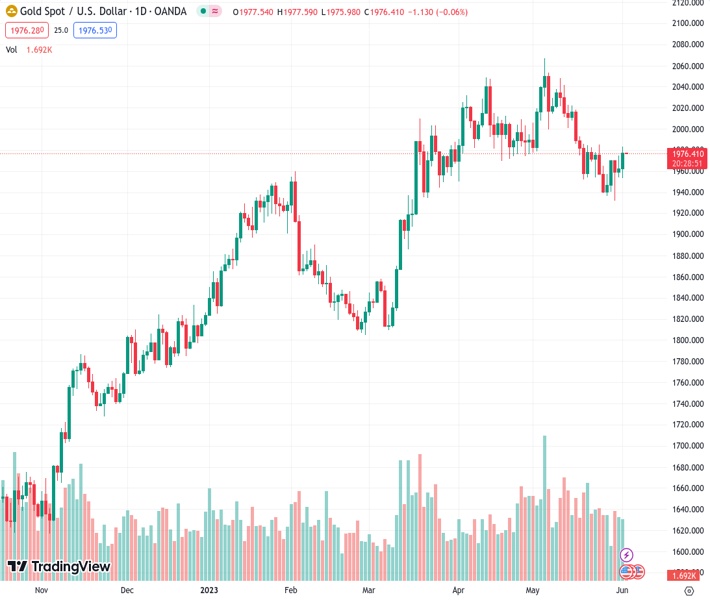
#XAUUSD @ 1,976.35 Gold price is aiming for a sustained break above $1,980 as Fed policymakers are divided about June’s interest rate policy. (Pivot Orderbook analysis)
…
This is a premium post.
[s2If !current_user_can(access_s2member_level4)]Please register for FREE REGISTER to read full post below containing analysis. In case of any error or you think you are not able to read the full post below, please email us at support#nehcap.com [lwa][/s2If] [s2If current_user_can(access_s2member_level1)]
- Gold price is aiming for a sustained break above $1,980 as Fed policymakers are divided about June’s interest rate policy.
- Fed Harker and Jefferson advocated a pause in the policy-tightening spell while Fed Mester sees no reason for a pause.
- Gold price is gathering strength for breaking above the horizontal resistance at $1,984.25 after a downward-sloping trendline breakout.
The pair currently trades last at 1976.35.
The previous day high was 1983.17 while the previous day low was 1953.41. The daily 38.2% Fib levels comes at 1971.8, expected to provide support. Similarly, the daily 61.8% fib level is at 1964.78, expected to provide support.
Gold price (XAU/USD) has sensed marginal selling pressure after failing to sustain above the crucial resistance of $1,980.00 in the Asian session. The precious metal showed a solid upside on Thursday, capitalizing efficiently on a sell-off in the US Dollar Index (DXY).
S&P500 futures have added nominal gains in Asia. The risk-appetite theme is in action as US equities were heavily bought on Thursday after Federal Reserve (Fed) policymakers remained divided over their stance about interest rate guidance for June’s monetary policy meeting.
The US Dollar Index (DXY) was badly beaten after support for a pause in the rate-hiking spell from Fed policymakers. Philadelphia Federal Reserve Bank President Patrick Harker and Fed Governor Philip Jefferson favored a neutral interest rate policy and advised them to remain dependent on economic indicators. However, Cleveland Fed Bank President, Loretta Mester doesn’t see a compelling reason of pausing the policy-tightening regime.
It seems that confusion over interest rate action would ease sharply after the release of the United States Nonfarm Payrolls (NFP) data (May). Analysts at Wells Fargo expect NFP to increase by 200K. They believe it is important to keep a close eye on wage growth and the labor force participation numbers. The labor force has grown at a healthy pace over the past year, and a further deceleration in wages alongside expanding supply would be an encouraging sign in the Federal Reserve’s fight to get inflation back to 2%.
Gold price has delivered a breakout of the downward-sloping trendline plotted from an all-time high at $2,079.76 on a two-hour scale. The precious metal is gathering strength for breaking above the horizontal resistance plotted from May 19 high at $1,984.25.
A bull cross, represented by the 20-and 50-period Exponential Moving Averages (EMAs) at $1,954.70, advocates more upside ahead.
The Relative Strength Index (RSI) (14) has shifted into the bullish range of 60.00-80.00, which indicates that the upside momentum is active now.
Technical Levels: Supports and Resistances
XAUUSD currently trading at 1976.9 at the time of writing. Pair opened at 1977.76 and is trading with a change of -0.04 % .
| Overview | Overview.1 | |
|---|---|---|
| 0 | Today last price | 1976.90 |
| 1 | Today Daily Change | -0.86 |
| 2 | Today Daily Change % | -0.04 |
| 3 | Today daily open | 1977.76 |
The pair is trading below its 20 Daily moving average @ 1984.35, below its 50 Daily moving average @ 1992.3 , above its 100 Daily moving average @ 1938.6 and above its 200 Daily moving average @ 1834.73
| Trends | Trends.1 | |
|---|---|---|
| 0 | Daily SMA20 | 1984.35 |
| 1 | Daily SMA50 | 1992.30 |
| 2 | Daily SMA100 | 1938.60 |
| 3 | Daily SMA200 | 1834.73 |
The previous day high was 1983.17 while the previous day low was 1953.41. The daily 38.2% Fib levels comes at 1971.8, expected to provide support. Similarly, the daily 61.8% fib level is at 1964.78, expected to provide support.
Note the levels of interest below:
- Pivot support is noted at 1959.72, 1941.69, 1929.96
- Pivot resistance is noted at 1989.48, 2001.21, 2019.24
| Levels | Levels.1 |
|---|---|
| Previous Daily High | 1983.17 |
| Previous Daily Low | 1953.41 |
| Previous Weekly High | 1985.30 |
| Previous Weekly Low | 1936.77 |
| Previous Monthly High | 2079.76 |
| Previous Monthly Low | 1932.12 |
| Daily Fibonacci 38.2% | 1971.80 |
| Daily Fibonacci 61.8% | 1964.78 |
| Daily Pivot Point S1 | 1959.72 |
| Daily Pivot Point S2 | 1941.69 |
| Daily Pivot Point S3 | 1929.96 |
| Daily Pivot Point R1 | 1989.48 |
| Daily Pivot Point R2 | 2001.21 |
| Daily Pivot Point R3 | 2019.24 |
[/s2If]
Nehcap Expert Advisor
The NEHCAP MT4 EA is high quality professional trading system geared to generate returns without using GRID or martingales. Each trade has strict risk per trade parameter. The pairs under management include EURUSD, GBPUSD, AUDCAD, AUDNZD,GBPAUD, EURAUD, EURCAD, CHFJPY and many more.
The system is trading live: LIVE ACCOUNT TRACKING
You can run it free. Apply for a free trial and track our account. Buy the system or use profit share mechanism to generate returns on your MT4.
Join Our Telegram Group
")


