WTI bulls take a breather at the weekly top after rising the most in a month. (Pivot Orderbook analysis)
…
This is a premium post.
[s2If !current_user_can(access_s2member_level4)]Please register for FREE REGISTER to read full post below containing analysis. In case of any error or you think you are not able to read the full post below, please email us at support#nehcap.com [lwa][/s2If] [s2If current_user_can(access_s2member_level1)]
- WTI bulls take a breather at the weekly top after rising the most in a month.
- Softer US Dollar, risk-on mood and firmer China data allow Oil buyers to stay hopeful.
- Surprise building in EIA inventories, hopes of no OPEC+ supply cuts prods Oil buyers.
- US NFP, risk catalysts eyed for clear directions, USD moves are the key.
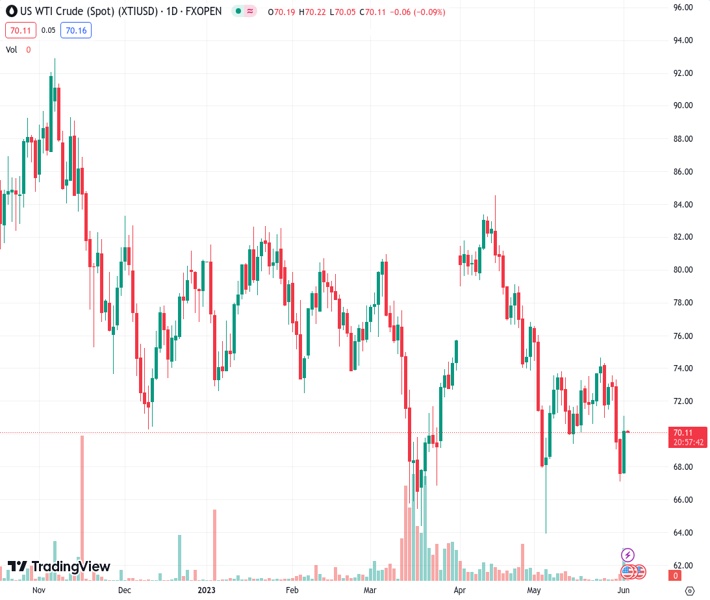
The pair currently trades last at 70.14.
The previous day high was 69.74 while the previous day low was 67.12. The daily 38.2% Fib levels comes at 68.12, expected to provide support. Similarly, the daily 61.8% fib level is at 68.74, expected to provide support.
WTI crude oil fades upside momentum around $70.00 during early Friday in Asia, after rising the most in one month the previous day. In doing so, the Oil price portrays the typical pre-NFP positioning of the markets while also justifying the price-negative catalysts from the energy industry. However, risk-on mood, softer US Dollar and expectations of the delay in the Fed rate hike seem putting a floor under the Oil price.
The US Dollar weakness is the biggest catalyst to favor the Oil buyers. That said, US Dollar Index (DXY) seesaws around 103.56 after a 0.65% daily fall marked on Thursday, the most in a month, to reverse from the highest levels since mid-March.
That said, the United States Treasury bond yields also refreshed the weekly lows as the market’s pricing of the Fed rate hike dropped. Adding strength to the DXY could be mixed US data and receding hopes of a faster Fed rate hike, as well as firmer data from China and passage of the US debt ceiling agreement in the US House of Representatives.
Elsewhere, a surprise build in the weekly inventories reported by the US Energy Information Administration (EIA), 4.488M for the week ended on May 26, versus -1.386M expected and -12.456M prior, weigh on the Oil prices.
On the same line are the concerns that the Organization of the Petroleum Exporting Countries and allies led by Russia, known as the OPEC+, are unlikely to deepen supply cuts at their ministerial meeting on Sunday despite a fall in oil prices toward $70 per barrel, four sources from the alliance told Reuters.
Amid these plays, the Oil buyers are likely to wait for more clues to witness further upside.
Looking forward, developments surrounding the US bill to avoid default may entertain the Oil traders ahead of the US jobs report for May. forecasts surrounding the US Nonfarm Payrolls (NFP) to ease to 190K from 253K prior while the Unemployment Rate is also expected to increase to 3.5% from 3.4%.
Unless crossing a descending resistance line from April 12, around $72.65 by the press time, WTI remains off the buyer’s table.
Technical Levels: Supports and Resistances
XTIUSD currently trading at 70.14 at the time of writing. Pair opened at 67.65 and is trading with a change of 3.68 % .
| Overview | Overview.1 | |
|---|---|---|
| 0 | Today last price | 70.14 |
| 1 | Today Daily Change | 2.49 |
| 2 | Today Daily Change % | 3.68 |
| 3 | Today daily open | 67.65 |
The pair remains strongly bearish on the daily time frame. It trades below the 20 SMA @ 71.69, 50 SMA 74.73, 100 SMA @ 75.86 and 200 SMA @ 79.3.
| Trends | Trends.1 | |
|---|---|---|
| 0 | Daily SMA20 | 71.69 |
| 1 | Daily SMA50 | 74.73 |
| 2 | Daily SMA100 | 75.86 |
| 3 | Daily SMA200 | 79.30 |
The previous day high was 69.74 while the previous day low was 67.12. The daily 38.2% Fib levels comes at 68.12, expected to provide support. Similarly, the daily 61.8% fib level is at 68.74, expected to provide support.
Note the levels of interest below:
- Pivot support is noted at 66.6, 65.55, 63.98
- Pivot resistance is noted at 69.22, 70.79, 71.84
| Levels | Levels.1 |
|---|---|
| Previous Daily High | 69.74 |
| Previous Daily Low | 67.12 |
| Previous Weekly High | 74.70 |
| Previous Weekly Low | 70.66 |
| Previous Monthly High | 76.61 |
| Previous Monthly Low | 64.31 |
| Daily Fibonacci 38.2% | 68.12 |
| Daily Fibonacci 61.8% | 68.74 |
| Daily Pivot Point S1 | 66.60 |
| Daily Pivot Point S2 | 65.55 |
| Daily Pivot Point S3 | 63.98 |
| Daily Pivot Point R1 | 69.22 |
| Daily Pivot Point R2 | 70.79 |
| Daily Pivot Point R3 | 71.84 |
[/s2If]
Nehcap Expert Advisor
The NEHCAP MT4 EA is high quality professional trading system geared to generate returns without using GRID or martingales. Each trade has strict risk per trade parameter. The pairs under management include EURUSD, GBPUSD, AUDCAD, AUDNZD,GBPAUD, EURAUD, EURCAD, CHFJPY and many more.
The system is trading live: LIVE ACCOUNT TRACKING
You can run it free. Apply for a free trial and track our account. Buy the system or use profit share mechanism to generate returns on your MT4.
Join Our Telegram Group
")


