#USDMXN @ 17.5280 US jobs growth exceeds estimates, yet slips by 0.12%. (Pivot Orderbook analysis)
…
This is a premium post.
[s2If !current_user_can(access_s2member_level4)]Please register for FREE REGISTER to read full post below containing analysis. In case of any error or you think you are not able to read the full post below, please email us at support#nehcap.com [lwa][/s2If] [s2If current_user_can(access_s2member_level1)]
- US jobs growth exceeds estimates, yet USD/MXN slips by 0.12%.
- US Treasury bond yields’ increase lends some support to USD/MXN.
- Bank of Mexico’s stand on record high-interest rates adds resilience to the Peso.
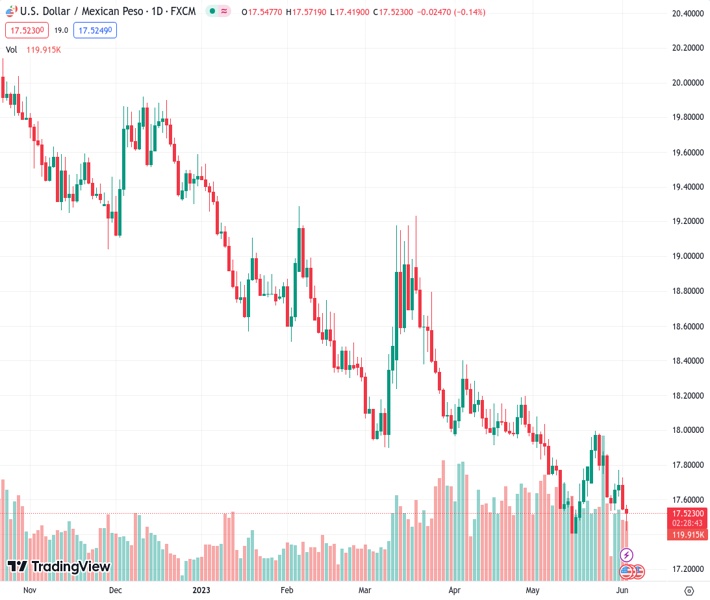
The pair currently trades last at 17.5280.
The previous day high was 17.7286 while the previous day low was 17.5409. The daily 38.2% Fib levels comes at 17.6126, expected to provide resistance. Similarly, the daily 61.8% fib level is at 17.6569, expected to provide resistance.
USD/MXN trims some of its losses but remains trading negatively, despite a solid US jobs report revealed before Wall Street opened, which did not stop the Mexican Peso from reaching new weekly lows. Traders’ mood improvement, seen as US equities post gains, cushioned the MXN from falling against its counterpart, the US Dollar (USD). At the time of writing, the USD/MXN is trading at 17.5308, down 0.10%.
The USD/MXN dropped sharply from around 17.5000s toward the lows of the week of 17.4190 after the US Bureau of Labor Statistics (BLS) revealed Nonfarm Payrolls in May crushed analysts’ estimates of 190K, with the economy adding 339K jobs. Although the headline figure is impressive, digging a little deep, the Unemployment Rate jumped from 3.4% to 3.7%. Regarding wages, inflation, known as Average Hourly Earnings, rose 0.3% MoM but edged down from April 4.4% to 4.3%.
Later, the USD/MXN rallied, about to erase its earlier losses, as traders digested the US jobs report, underpinned by rising US Treasury bond yields. The 10-year benchmark note rate is 3.69%, ten basis points (bps) higher than Thursday’s close.
In the meantime, the US Dollar Index (DXY), a gauge of the buck’s value against a basket of six currencies, advances 0.47%, up above 104.000, set to finish the week with losses of 0.17%.
Across the border, Mexico’s Unemployment Rate for April was 2.8%, above estimates of 2.7%. Aside from this, the latest meeting minutes of the Bank of Mexico (Banxico) showed inflation and inflationary pressures cooling down after the bank held rates at 11.25%. On Wednesday, Banxico{s Governor Victoria Rodriguez Ceja said that the institution she commands would keep rates at record high for at least the two following meetings.
Given the fundamental backdrop, the USD/MXN remains downward biased, but recent price action could form a double bottom. Even though it’s just a double dip toward the 17.4000 area, it’s worth considering due to the latest downtrend, which started in November 2021, with the USD/MXN plunging 20%. If USD/MXN surpasses that support, the next stop would be the 17.0000 figure. Otherwise, if USD/MXN reclaims the 18.0000 figure, it will conform to the double bottom. Above this area, the USD/MXN’s next stop would be the 100-day EMA at 18.2563, followed by the April 5 daily high of 18.4010.
Technical Levels: Supports and Resistances
USDMXN currently trading at 17.5335 at the time of writing. Pair opened at 17.5532 and is trading with a change of -0.11 % .
| Overview | Overview.1 | |
|---|---|---|
| 0 | Today last price | 17.5335 |
| 1 | Today Daily Change | -0.0197 |
| 2 | Today Daily Change % | -0.1100 |
| 3 | Today daily open | 17.5532 |
The pair remains strongly bearish on the daily time frame. It trades below the 20 SMA @ 17.687, 50 SMA 17.9287, 100 SMA @ 18.2672 and 200 SMA @ 18.9978.
| Trends | Trends.1 | |
|---|---|---|
| 0 | Daily SMA20 | 17.6870 |
| 1 | Daily SMA50 | 17.9287 |
| 2 | Daily SMA100 | 18.2672 |
| 3 | Daily SMA200 | 18.9978 |
The previous day high was 17.7286 while the previous day low was 17.5409. The daily 38.2% Fib levels comes at 17.6126, expected to provide resistance. Similarly, the daily 61.8% fib level is at 17.6569, expected to provide resistance.
Note the levels of interest below:
- Pivot support is noted at 17.4866, 17.4199, 17.2989
- Pivot resistance is noted at 17.6742, 17.7952, 17.8619
| Levels | Levels.1 |
|---|---|
| Previous Daily High | 17.7286 |
| Previous Daily Low | 17.5409 |
| Previous Weekly High | 17.9981 |
| Previous Weekly Low | 17.6165 |
| Previous Monthly High | 18.0780 |
| Previous Monthly Low | 17.4203 |
| Daily Fibonacci 38.2% | 17.6126 |
| Daily Fibonacci 61.8% | 17.6569 |
| Daily Pivot Point S1 | 17.4866 |
| Daily Pivot Point S2 | 17.4199 |
| Daily Pivot Point S3 | 17.2989 |
| Daily Pivot Point R1 | 17.6742 |
| Daily Pivot Point R2 | 17.7952 |
| Daily Pivot Point R3 | 17.8619 |
[/s2If]
Nehcap Expert Advisor
The NEHCAP MT4 EA is high quality professional trading system geared to generate returns without using GRID or martingales. Each trade has strict risk per trade parameter. The pairs under management include EURUSD, GBPUSD, AUDCAD, AUDNZD,GBPAUD, EURAUD, EURCAD, CHFJPY and many more.
The system is trading live: LIVE ACCOUNT TRACKING
You can run it free. Apply for a free trial and track our account. Buy the system or use profit share mechanism to generate returns on your MT4.
Join Our Telegram Group
")


