#USDCAD @ 1.34399 US adds 339K jobs, beating estimates, but stays tepid. (Pivot Orderbook analysis)
…
This is a premium post.
[s2If !current_user_can(access_s2member_level4)]Please register for FREE REGISTER to read full post below containing analysis. In case of any error or you think you are not able to read the full post below, please email us at support#nehcap.com [lwa][/s2If] [s2If current_user_can(access_s2member_level1)]
- US adds 339K jobs, beating estimates, but USD/CAD stays tepid.
- CAD gains momentum on a 1.70% surge in WTI Crude Oil prices.
- Uncertain Fed rate hike in July overshadows USD’s future trajectory.
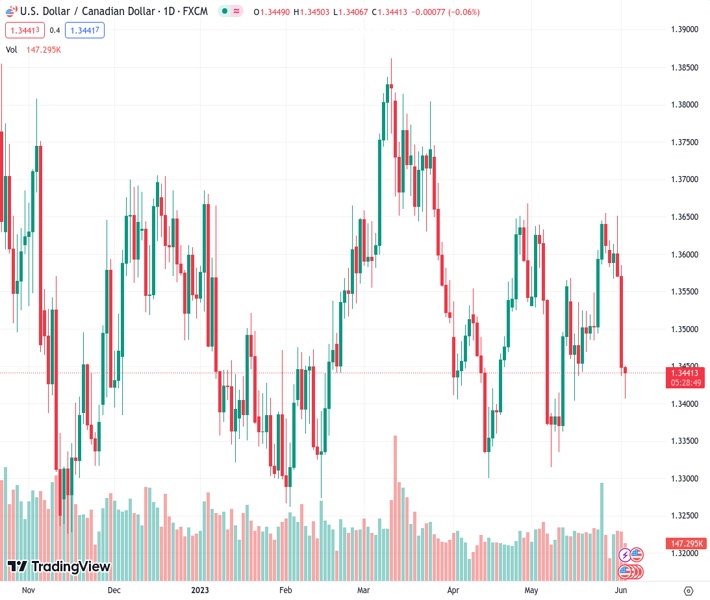
The pair currently trades last at 1.34399.
The previous day high was 1.3585 while the previous day low was 1.3436. The daily 38.2% Fib levels comes at 1.3493, expected to provide resistance. Similarly, the daily 61.8% fib level is at 1.3528, expected to provide resistance.
USD/CAD registers modest losses after an outstanding jobs report in the United States (US) would likely keep the US Federal Reserve (Fed) hitting the economy’s brakes, despite recent dovish comments supporting a pause. Nevertheless, the US Dollar (USD) continued to weaken while the Loonie (CAD) strengthened. At the time of writing, the USD/CAD is trading at 1.3428, down 0.16%.
The USD/CAD stopped its fall at around the 200-day Exponential Moving Average (EMA) at 1.3417 on the release of May’s US Nonfarm Payrolls report, revealed by the US Department of Labor. The US economy created 339K jobs in the economy, crushing estimates of 190K, though the Unemployment Rate ticked higher to 3.7% from 3.4%, a 53-year low level.
Although the data supported a stronger US Dollar, the USD/CAD treads water after printing a daily low of 1.3406 ahead of the Nonfarm Payrolls release.
Given the backdrop, crude oil prices were another factor that boosted the CAD, with Western Texas Intermediate (WTI), the US crude oil benchmark, recovering ground gaining 1.70%, at $71.33 per barrel, along with a risk-on impulse, that keeps the greenback pressured through pairing some losses.
The US Dollar Index (DXY), a measure that tracks the buck’s value vs. six currencies, edges up 0.31%, at 103.888, underpinned by increased bets for a July rate hike by the Fed. According to the recent update from the CME FedWatch Tool, the Federal Reserve will likely maintain the current interest rates steady for the month. However, the forecast for July is considerably less definitive, with the likelihood of a rate change teetering at approximately 50.7%.
An absent Canadian economic docket left USD/CAD traders leaning on the dynamics of the US Dollar. But recent data showing strong growth in the Canadian economy puts pressure on the Bank of Canada (BoC) to further tighten the economy, at the threat of elevated inflationary pressures.
From a technical perspective, USD/CAD faced solid support at the 200-day EMA, with buyers piling in, driving the price 30 pips up. Nevertheless, the Relative Strength Index (RSI) indicator and the 3-day Rate of Change (RoC) in bearish territory suggest downside action in the near term. Therefore, the USD/CAD could be pressured, with support back at the 200-day EMA at 1.3417, before testing 1.3400. Break below will expose May’s low of 1.3314. Conversely, the USD/CAD first resistance would be the 1.3500 figure, followed by the 100-day EMA at 1.3510.
Technical Levels: Supports and Resistances
USDCAD currently trading at 1.3438 at the time of writing. Pair opened at 1.345 and is trading with a change of -0.09 % .
| Overview | Overview.1 | |
|---|---|---|
| 0 | Today last price | 1.3438 |
| 1 | Today Daily Change | -0.0012 |
| 2 | Today Daily Change % | -0.0900 |
| 3 | Today daily open | 1.3450 |
The pair remains strongly bearish on the daily time frame. It trades below the 20 SMA @ 1.3502, 50 SMA 1.3513, 100 SMA @ 1.3517 and 200 SMA @ 1.3505.
| Trends | Trends.1 | |
|---|---|---|
| 0 | Daily SMA20 | 1.3502 |
| 1 | Daily SMA50 | 1.3513 |
| 2 | Daily SMA100 | 1.3517 |
| 3 | Daily SMA200 | 1.3505 |
The previous day high was 1.3585 while the previous day low was 1.3436. The daily 38.2% Fib levels comes at 1.3493, expected to provide resistance. Similarly, the daily 61.8% fib level is at 1.3528, expected to provide resistance.
Note the levels of interest below:
- Pivot support is noted at 1.3396, 1.3342, 1.3247
- Pivot resistance is noted at 1.3544, 1.3639, 1.3693
| Levels | Levels.1 |
|---|---|
| Previous Daily High | 1.3585 |
| Previous Daily Low | 1.3436 |
| Previous Weekly High | 1.3655 |
| Previous Weekly Low | 1.3485 |
| Previous Monthly High | 1.3655 |
| Previous Monthly Low | 1.3315 |
| Daily Fibonacci 38.2% | 1.3493 |
| Daily Fibonacci 61.8% | 1.3528 |
| Daily Pivot Point S1 | 1.3396 |
| Daily Pivot Point S2 | 1.3342 |
| Daily Pivot Point S3 | 1.3247 |
| Daily Pivot Point R1 | 1.3544 |
| Daily Pivot Point R2 | 1.3639 |
| Daily Pivot Point R3 | 1.3693 |
[/s2If]
Nehcap Expert Advisor
The NEHCAP MT4 EA is high quality professional trading system geared to generate returns without using GRID or martingales. Each trade has strict risk per trade parameter. The pairs under management include EURUSD, GBPUSD, AUDCAD, AUDNZD,GBPAUD, EURAUD, EURCAD, CHFJPY and many more.
The system is trading live: LIVE ACCOUNT TRACKING
You can run it free. Apply for a free trial and track our account. Buy the system or use profit share mechanism to generate returns on your MT4.
Join Our Telegram Group
")


