Oil price recovers for the second day after the debt-ceiling bill gets voted through by the US Senate.
…
This is a premium post.
[s2If !current_user_can(access_s2member_level4)]Please register for FREE REGISTER to read full post below containing analysis. In case of any error or you think you are not able to read the full post below, please email us at support#nehcap.com [lwa][/s2If] [s2If current_user_can(access_s2member_level1)]
- Oil price recovers for the second day after the debt-ceiling bill gets voted through by the US Senate.
- The possibility of OPEC+ announcing more production cuts at its June 4 meeting further supports Oil.
- The breakeven price for the Saudis is $80 a barrel despite Russia downplaying the need for cuts.
Oil price rallies for the second day on Friday as global markets breathe a sigh of relief after the US Senate votes through the debt-ceiling extension bill, vaulting the final hurdle prior to implementation. Increasing expectations that the US Federal Reserve (Fed) will pause on hiking rates at the next Fed meeting in mid-June caps the US Dollar’s progress, further helping Oil, which is priced in USD.
WTI Oil price is still broadly speaking in a longer-term downtrend that started in July 2022. Given the old saying that the trend is your friend, this favors short sellers over longs.
WTI Oil is trading below all the major daily and weekly Simple Moving Averages (SMAs) except the 200-week SMA at $66.90. On Wednesday it found support at this MA and began its recovery.
WTI US Oil: Weekly Chart
A bullish hammer candlestick is in the process of forming on the weekly chart but until the week is over it is impossible to say if it will fix. Even if it does, it would have to be followed by a bullish green bar next week to confirm the reversal.
Given the downtrend remains intact more downside is still possible, however, it would require a break below the year-to-date lows at $64.31 to confirm more downside.
Such a break could lead to the next target at around $62.00, where trough lows from 2021 will come into play, followed by support at $57.50.
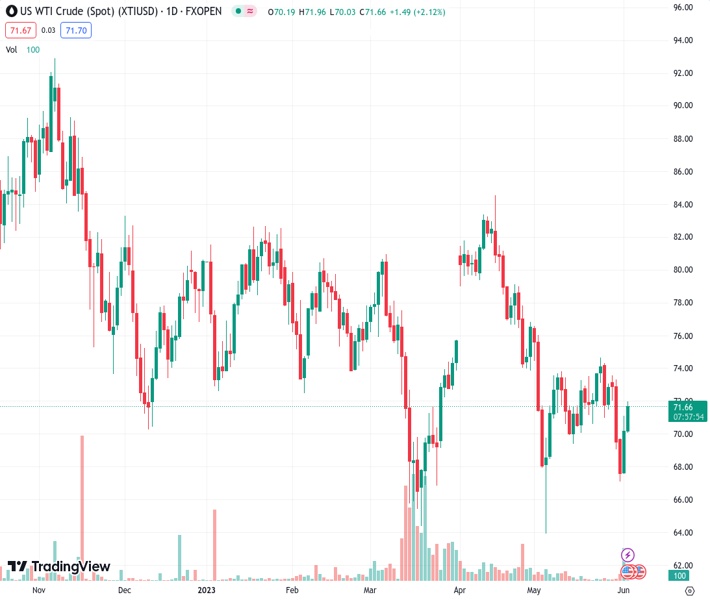
WTI US Oil: Daily Chart
Oil price needs to climb back above the $74.70 May 24 highs to raise significant doubts about the dominance of the bear trend.
Such a break might lead to a potential target in the $79.70s, which roughly coincides with the 200-day SMA and the main trendline for the bear market, heightening its importance as a key resistance level.
The long hammer Japanese candlestick pattern that formed at the May 4 (and YTD) lows is a sign that Oil price may have formed a strategic bottom at that level and raises the suspicion the bear trend may be reaching a conclusion.
[/s2If]
Nehcap Expert Advisor
The NEHCAP MT4 EA is high quality professional trading system geared to generate returns without using GRID or martingales. Each trade has strict risk per trade parameter. The pairs under management include EURUSD, GBPUSD, AUDCAD, AUDNZD,GBPAUD, EURAUD, EURCAD, CHFJPY and many more.
The system is trading live: LIVE ACCOUNT TRACKING
You can run it free. Apply for a free trial and track our account. Buy the system or use profit share mechanism to generate returns on your MT4.
Join Our Telegram Group
")


