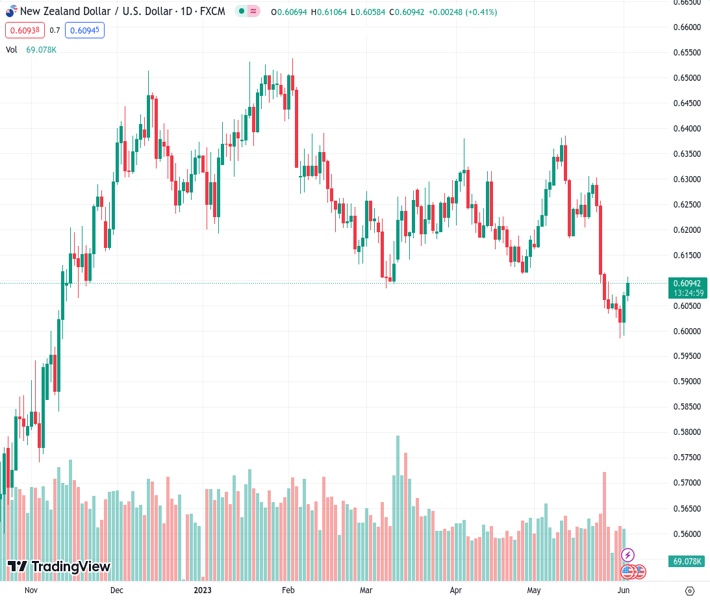
#NZDUSD @ 0.60943 climbs to over a one-week high on Friday amid some follow-through USD selling. (Pivot Orderbook analysis)
…
This is a premium post.
[s2If !current_user_can(access_s2member_level4)]Please register for FREE REGISTER to read full post below containing analysis. In case of any error or you think you are not able to read the full post below, please email us at support#nehcap.com [lwa][/s2If] [s2If current_user_can(access_s2member_level1)]
- NZD/USD climbs to over a one-week high on Friday amid some follow-through USD selling.
- Diminishing odds for another 25 bps Fed rate hike in June continue to weigh on the buck.
- A positive risk tone further benefits the risk-sensitive Kiwi ahead of the key US NFP report.
The pair currently trades last at 0.60943.
The previous day high was 0.6078 while the previous day low was 0.599. The daily 38.2% Fib levels comes at 0.6044, expected to provide support. Similarly, the daily 61.8% fib level is at 0.6024, expected to provide support.
The NZD/USD pair builds on the previous day’s solid recovery from the vicinity of its lowest level since November 2022 and gains strong follow-through traction for the second successive day on Friday. The pair maintains its bid tone through the early European session and currently trades near a one-week high, with bulls now awaiting a sustained move beyond the 0.6100 mark before placing fresh bets.
The US Dollar (USD) remains depressed amid firming expectations that the Federal Reserve (Fed) will skip an interest rate hike at its meeting later this month and turns out to be a key factor acting as a tailwind for the NZD/USD pair. In fact, Philadelphia Fed President Patrick Harker reiterated on Thursday that it’s time to at least hit the stop button for one meeting and see how it goes. This comes on the back of the recent comments by a slew of influential FOMC officials, which forced investors to scale back their expectations for another 25 bps lift-off in June. This led to a further decline in the US Treasury bond yields on Thursday and continues to weigh the Greenback.
Apart from this, Thursday’s disappointing release of the US ISM Manufacturing PMI, which contracted for the seventh straight time in May, and a positive risk tone further undermines the safe-haven buck and benefits the risk-sensitive Kiwi. A private survey showed on Thursday that China’s manufacturing sector unexpectedly registered modest growth in May, raising hopes of a recovery in the world’s second-largest economy. Furthermore, the passage of bipartisan legislation to lift the government’s $31.4 trillion debt ceiling and avert an unprecedented American default boosts investors’ confidence. Meanwhile, the USD bulls seem unimpressed by the upbeat US ADP report.
That said, the Reserve Bank of New Zealand’s (RBNZ) explicit signal last week that it was done with its most aggressive hiking cycle since 1999 could act as a headwind for the domestic currency. Traders also seem reluctant to place aggressive bullish bets around the NZD/USD pair and prefer to wait on the sidelines ahead of the release of the closely-watched US monthly jobs data, due later during the early North American session. The popularly known NFP report will play a key role in influencing the USD price dynamics and provide a fresh directional impetus to the major.
Technical Levels: Supports and Resistances
NZDUSD currently trading at 0.6097 at the time of writing. Pair opened at 0.6071 and is trading with a change of 0.43 % .
| Overview | Overview.1 | |
|---|---|---|
| 0 | Today last price | 0.6097 |
| 1 | Today Daily Change | 0.0026 |
| 2 | Today Daily Change % | 0.4300 |
| 3 | Today daily open | 0.6071 |
The pair remains strongly bearish on the daily time frame. It trades below the 20 SMA @ 0.6192, 50 SMA 0.6207, 100 SMA @ 0.6254 and 200 SMA @ 0.615.
| Trends | Trends.1 | |
|---|---|---|
| 0 | Daily SMA20 | 0.6192 |
| 1 | Daily SMA50 | 0.6207 |
| 2 | Daily SMA100 | 0.6254 |
| 3 | Daily SMA200 | 0.6150 |
The previous day high was 0.6078 while the previous day low was 0.599. The daily 38.2% Fib levels comes at 0.6044, expected to provide support. Similarly, the daily 61.8% fib level is at 0.6024, expected to provide support.
Note the levels of interest below:
- Pivot support is noted at 0.6014, 0.5958, 0.5926
- Pivot resistance is noted at 0.6102, 0.6134, 0.619
| Levels | Levels.1 |
|---|---|
| Previous Daily High | 0.6078 |
| Previous Daily Low | 0.5990 |
| Previous Weekly High | 0.6303 |
| Previous Weekly Low | 0.6032 |
| Previous Monthly High | 0.6385 |
| Previous Monthly Low | 0.5985 |
| Daily Fibonacci 38.2% | 0.6044 |
| Daily Fibonacci 61.8% | 0.6024 |
| Daily Pivot Point S1 | 0.6014 |
| Daily Pivot Point S2 | 0.5958 |
| Daily Pivot Point S3 | 0.5926 |
| Daily Pivot Point R1 | 0.6102 |
| Daily Pivot Point R2 | 0.6134 |
| Daily Pivot Point R3 | 0.6190 |
[/s2If]
Nehcap Expert Advisor
The NEHCAP MT4 EA is high quality professional trading system geared to generate returns without using GRID or martingales. Each trade has strict risk per trade parameter. The pairs under management include EURUSD, GBPUSD, AUDCAD, AUDNZD,GBPAUD, EURAUD, EURCAD, CHFJPY and many more.
The system is trading live: LIVE ACCOUNT TRACKING
You can run it free. Apply for a free trial and track our account. Buy the system or use profit share mechanism to generate returns on your MT4.
Join Our Telegram Group
")


