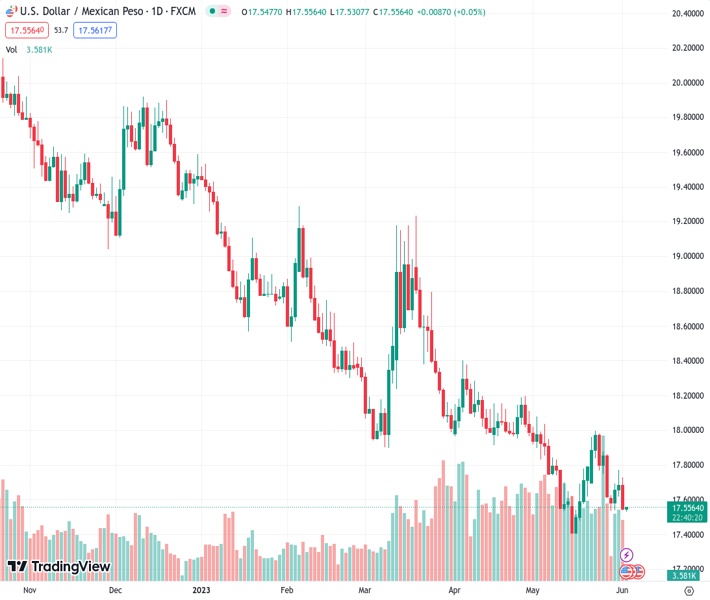
#USDMXN @ 17.5474 tumbles by 0.78%, underpinned by Banxico’s hawkish stance on maintaining higher interest rates, countering mixed US economic data. (Pivot Orderbook analysis)
…
This is a premium post.
[s2If !current_user_can(access_s2member_level4)]Please register for FREE REGISTER to read full post below containing analysis. In case of any error or you think you are not able to read the full post below, please email us at support#nehcap.com [lwa][/s2If] [s2If current_user_can(access_s2member_level1)]
- USD/MXN tumbles by 0.78%, underpinned by Banxico’s hawkish stance on maintaining higher interest rates, countering mixed US economic data.
- US manufacturing activity slows, with ISM PMI signaling a recessionary trend; the job market remains tight despite a surge in private hiring.
- Federal Reserve officials hint at bypassing June’s rate hike, while Bank of Mexico signals holding record-high interest rates for at least two more meetings.
The pair currently trades last at 17.5474.
The previous day high was 17.7716 while the previous day low was 17.6352. The daily 38.2% Fib levels comes at 17.7195, expected to provide resistance. Similarly, the daily 61.8% fib level is at 17.6873, expected to provide resistance.
USD/MXN dropped sharply, as the Mexican Peso (MXN) was bolstered by hawkish remarks by Bank of Mexico (Banxico) policymakers, while its minutes show the central bank’s commitment to hold rates higher. Furthermore, mixed economic data from the United States (US) hit the greenback, with the US Dollar (USD) registering its biggest daily loss since May 3. The USD/MXN is trading at 17.5444, down 0.78%.
Wall Street began June on the front foot, with gains spurred by the AI frenzy. The financial markets narrative shifted towards the economy after the US debt-ceiling issue was solved, though pending approval by the US Senate.
Delving into the USD/MXN, economic data from the US showed that manufacturing activity in May slowed, with the ISM PMI coming at 46.9, below forecasts, and April’s 47.1 – a recessionary signal, falling for a seven-straight month. Aside from this, the US Department of Labor revealed that unemployment claims for the week ending May 27 edged lowered, at 232K beneath estimates but exceeding the prior’s week release.
Further labor data showed that private hiring crushed April’s data, as demonstrated by the ADP Report, indicating that the economy added 278K jobs, surpassing 170k estimates, but lagged April’s 291K. This underlines a tight labor market.
Switching to central bank speakers, Federal Reserve officials led by Patrick Harker emphasized his stance for skipping June’s rate hike and commented that it’s time to hit the stop button at least for one meeting.
In the meantime, Banxico’s latest meeting minutes showed that inflation and inflationary pressures were easing but remained high at a meeting where the central bank held rates unchanged at 11.25%, which has put the carry trade in play and the minutes highlighted comments made on Wednesday that rates would remain on hold for “an extended period.”.
Meanwhile, Bank of Mexico officials led by Governor Victoria Rodriguez Ceja will hold interest rates at a record-high for at least the next two meetings before considering easing, she said.
Technical Levels: Supports and Resistances
USDMXN currently trading at 17.5523 at the time of writing. Pair opened at 17.6872 and is trading with a change of -0.76 % .
| Overview | Overview.1 | |
|---|---|---|
| 0 | Today last price | 17.5523 |
| 1 | Today Daily Change | -0.1349 |
| 2 | Today Daily Change % | -0.7600 |
| 3 | Today daily open | 17.6872 |
The pair remains strongly bearish on the daily time frame. It trades below the 20 SMA @ 17.705, 50 SMA 17.9491, 100 SMA @ 18.2801 and 200 SMA @ 19.0097.
| Trends | Trends.1 | |
|---|---|---|
| 0 | Daily SMA20 | 17.7050 |
| 1 | Daily SMA50 | 17.9491 |
| 2 | Daily SMA100 | 18.2801 |
| 3 | Daily SMA200 | 19.0097 |
The previous day high was 17.7716 while the previous day low was 17.6352. The daily 38.2% Fib levels comes at 17.7195, expected to provide resistance. Similarly, the daily 61.8% fib level is at 17.6873, expected to provide resistance.
Note the levels of interest below:
- Pivot support is noted at 17.6244, 17.5615, 17.4879
- Pivot resistance is noted at 17.7609, 17.8345, 17.8974
| Levels | Levels.1 |
|---|---|
| Previous Daily High | 17.7716 |
| Previous Daily Low | 17.6352 |
| Previous Weekly High | 17.9981 |
| Previous Weekly Low | 17.6165 |
| Previous Monthly High | 18.0780 |
| Previous Monthly Low | 17.4203 |
| Daily Fibonacci 38.2% | 17.7195 |
| Daily Fibonacci 61.8% | 17.6873 |
| Daily Pivot Point S1 | 17.6244 |
| Daily Pivot Point S2 | 17.5615 |
| Daily Pivot Point S3 | 17.4879 |
| Daily Pivot Point R1 | 17.7609 |
| Daily Pivot Point R2 | 17.8345 |
| Daily Pivot Point R3 | 17.8974 |
[/s2If]
Nehcap Expert Advisor
The NEHCAP MT4 EA is high quality professional trading system geared to generate returns without using GRID or martingales. Each trade has strict risk per trade parameter. The pairs under management include EURUSD, GBPUSD, AUDCAD, AUDNZD,GBPAUD, EURAUD, EURCAD, CHFJPY and many more.
The system is trading live: LIVE ACCOUNT TRACKING
You can run it free. Apply for a free trial and track our account. Buy the system or use profit share mechanism to generate returns on your MT4.
Join Our Telegram Group
")


